Analysts who wish to compare data from multiple reports prefer to have all data expressed in same units. UDM stores all data in the units in which the data is originally published. For example, USDA’s Dairy Market News Weekly Summary contains data on weekly average spot price for butter, cheese, nonfat dry milk and dry whey in $/lb (U.S. dollars per pound). In contrast, ZuivelNL (Dutch Dairy Board) publishes weekly prices for dairy commodities in €/100kg (Euros per 100 kilograms), Süddeutschen Butter- und Käse-Börse e.V. Kempten publishes prices for milk and whey powders in €/MT, etc.
This knowledge base article describes the protocol an analyst may follow to convert data to units of interest. The example used involves the conversion of dry whey and whey protein concentrate prices published in Dairy Market News Weekly Summary from $/lb to €/MT.
Step 1. Create connection to UDM_Units_Conversions
In the navigator window, locate the table UDM_Units_Conversions
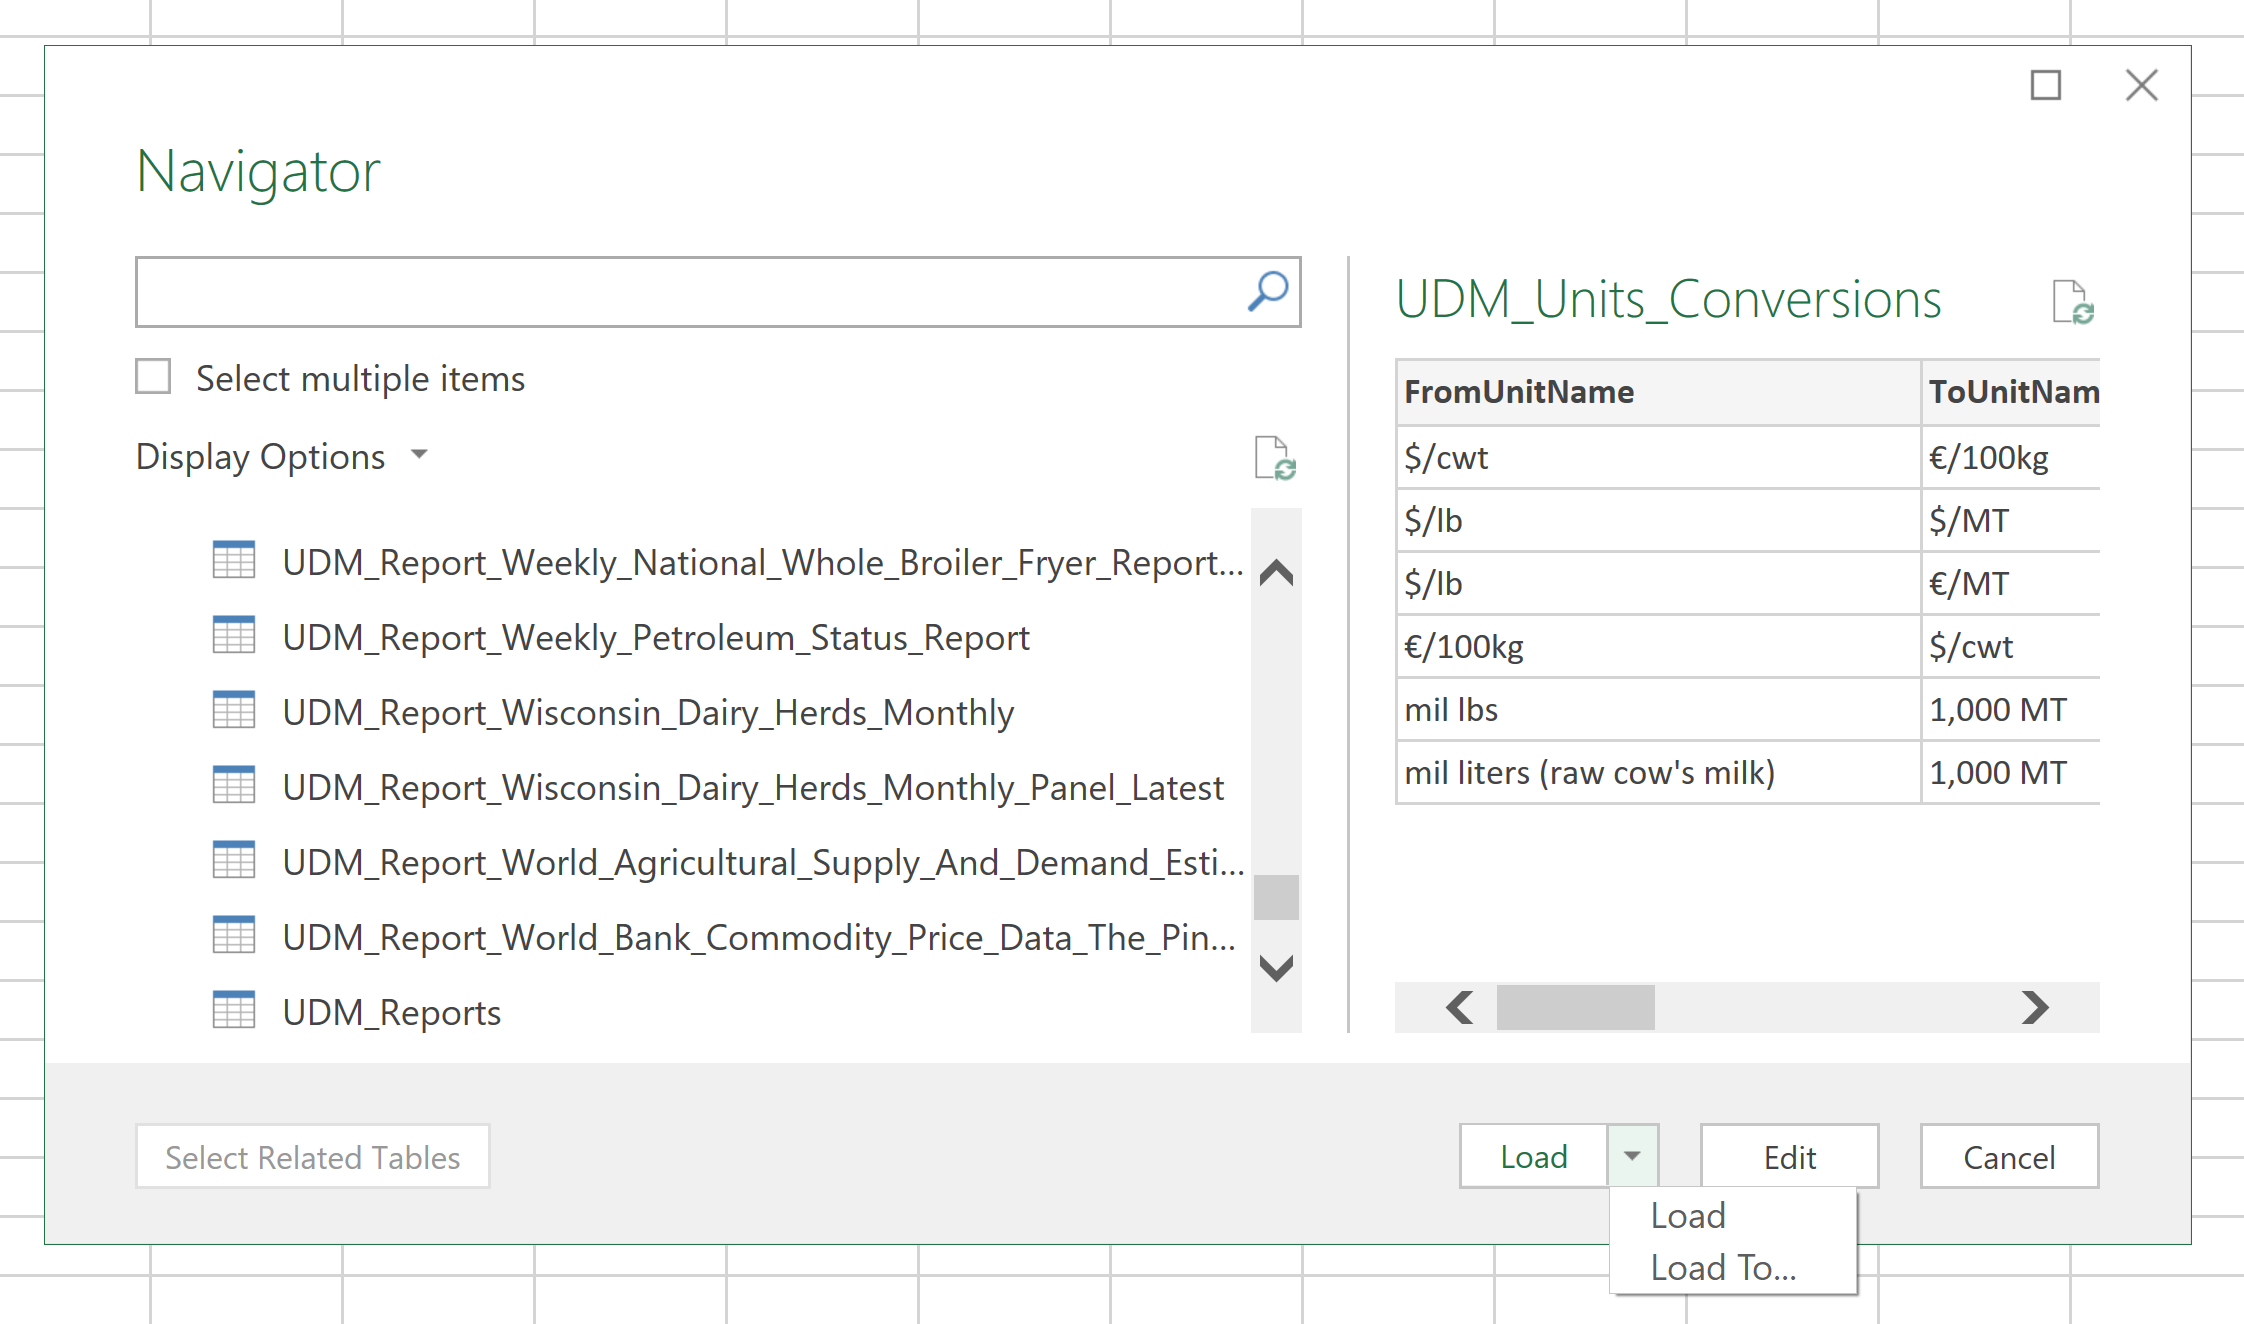
Click on the triangle next to “Load”, and choose Load To…
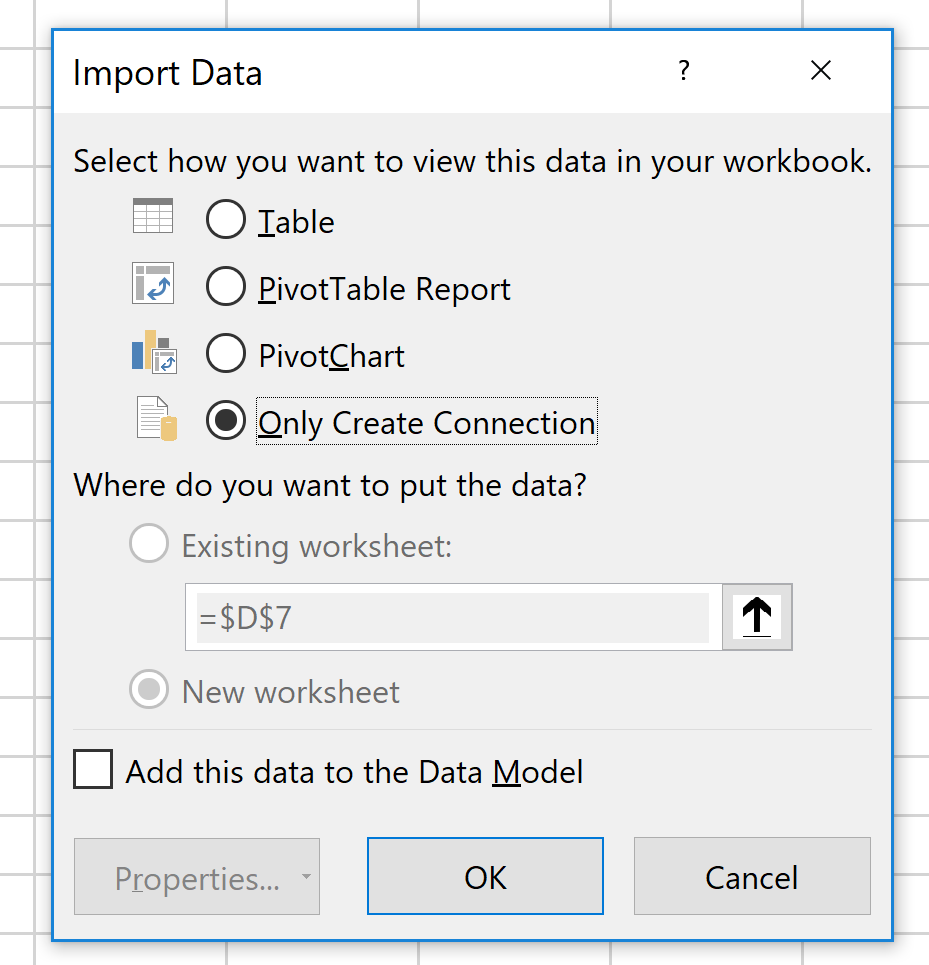 We do not need to load the UDM_Units_Conversions as a separate table, as we just want to create a connection to this table. In the menu, choose “Only Create Connection”, and click OK.
You can then edit UDM_Units_Conversions to examine the structure of this table in the Query Editor.
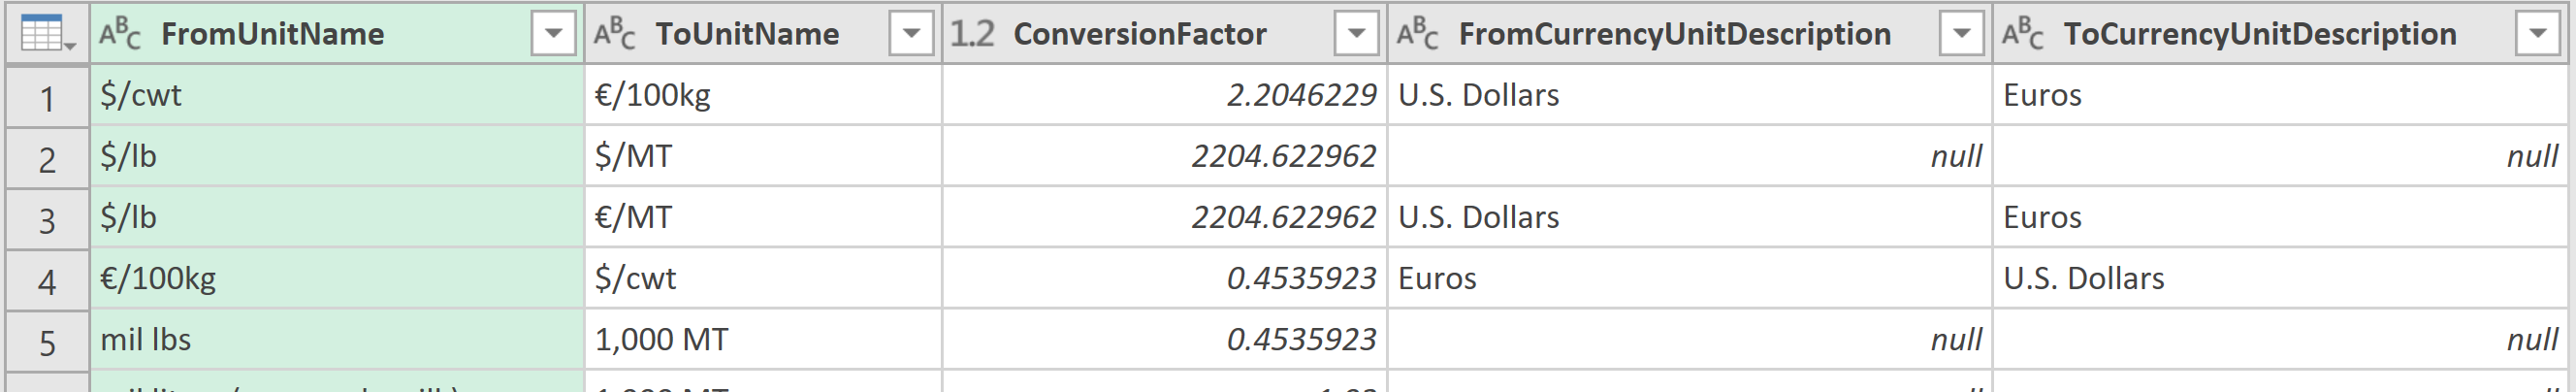
The table contains five fields. First two fields identify from, and to which unit is the data being converted. Conversion Factor is the number by which we will need to multiply the original data. If we are only converting weights, i.e. $/lb to $/MT, there are no additional steps we would need to do. If we are also changing currencies, from U.S. Dollars to Euros, then we will need the help of the last two fields, which identify the original and the final currency. We can trim the ToUnitName column to €/MT.

Step 2. Create the connection to UDM_Report_Currency_Exchange_Rates_Weekly_Panel_Latest
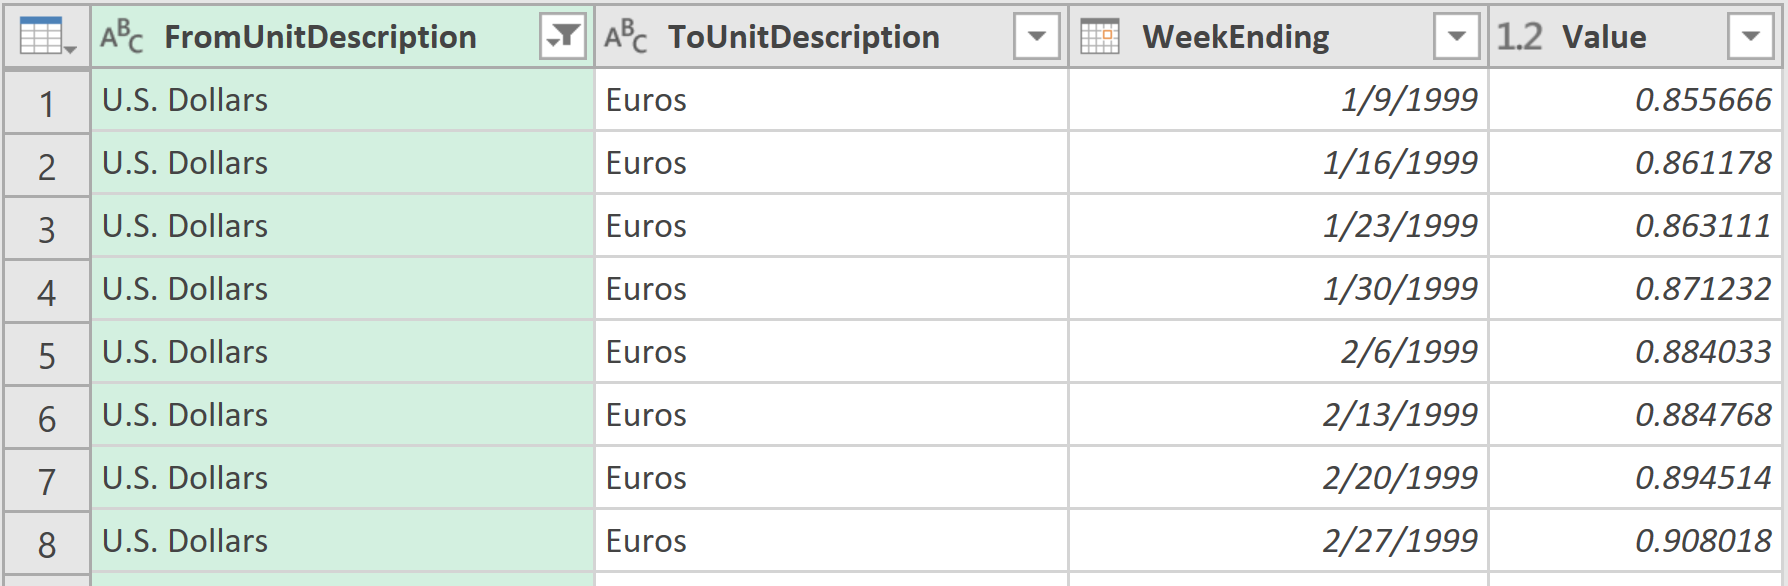
Repeat the same actions as in Step 1 to create connection to UDM_Report_Currency_Exchange_Rates_Weekly_Panel_Latest. You can examine the structure of this table in the Query Editor:
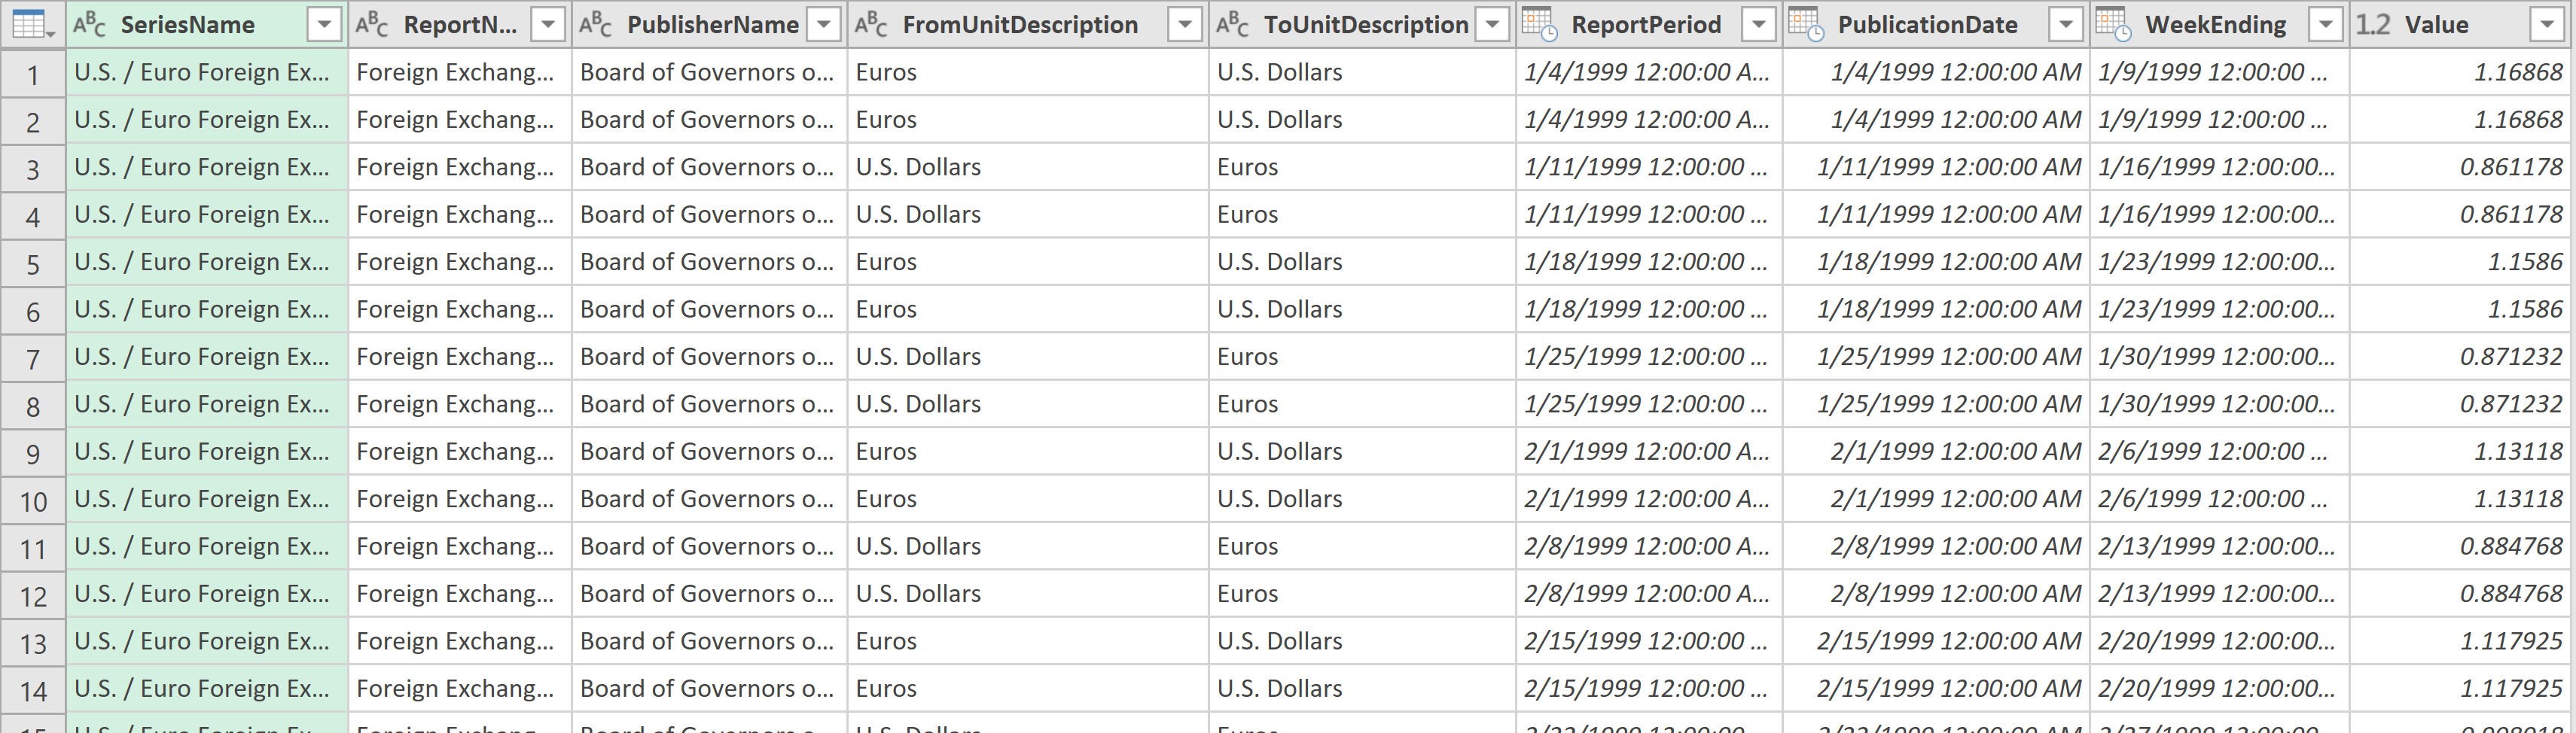
In this table you can make filtering as needed to trim the connection to only those series relevant to your task. For this exercise we only need to convert U.S. Dollars to Euros, so we will filter FromUnitDescription. We do not need SeriesName, ReportName, PublisherName, ReportPeriod and PublicationDate so we will remove those columns. We also transform WeekEnding to Date-type column.
Close and load.
Step 3. Edit UDM_Report_Dairy_Market_News_Weekly_Summary_Panel_Latest
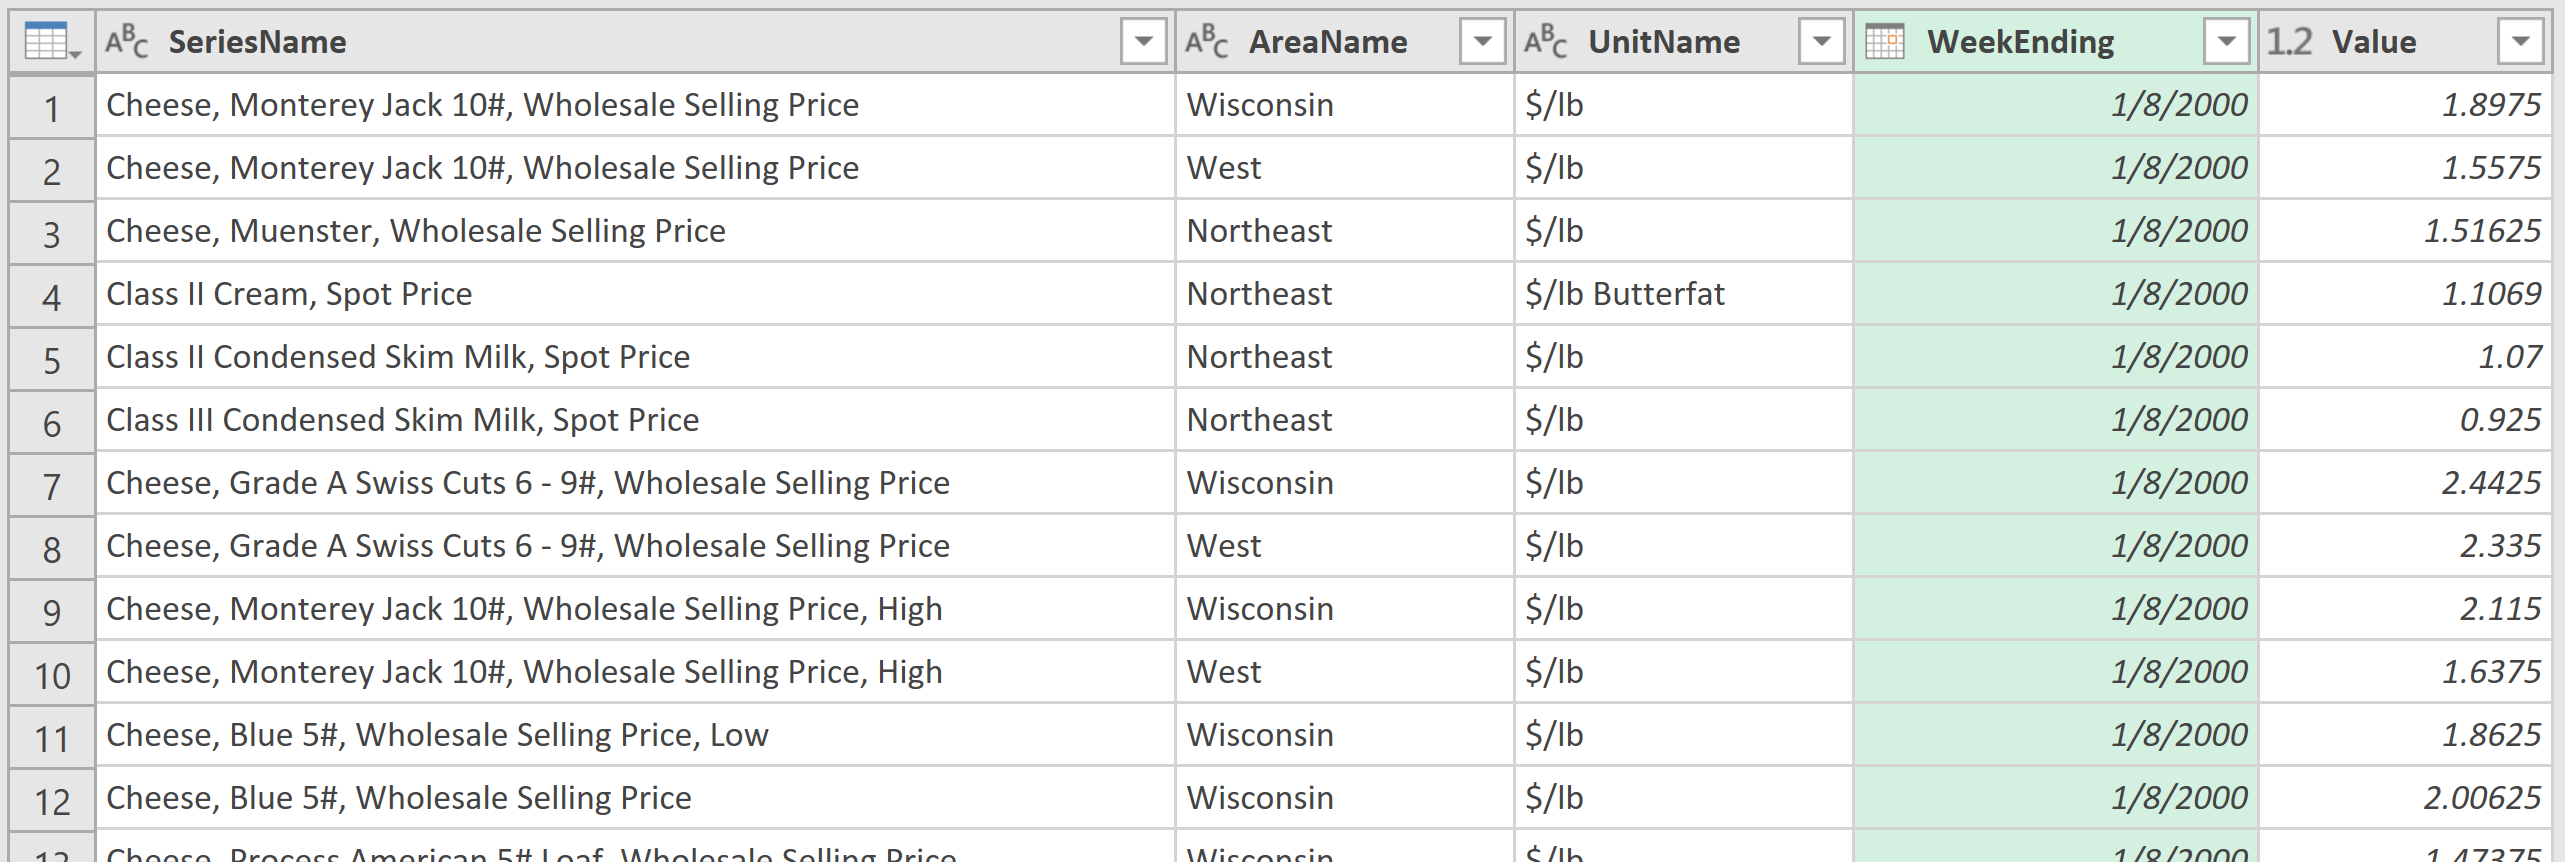
Find the table UDM_Report_Dairy_Market_News_Weekly_Summary_Panel_Latest and click “Edit” to edit it in the Query Editor.
We will first do some cleaning up – remove ReportPeriod, PublicationDate, Low and High columns, and transform WeekEnding to Date-type column.
Remain in the Query Editor.
Step 4. Merge the data table with UDM_Units_Conversions
Next, we will merge this table with UDM_Units_Conversions.
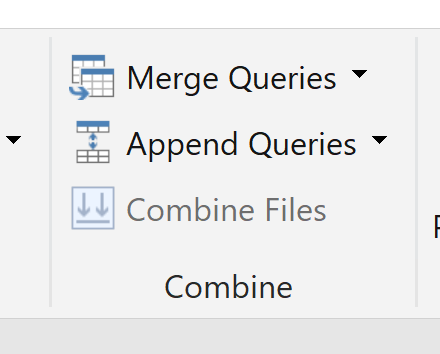
In the Home tab, under Combine group, click on “Merge Queries”:
You will be shown the “Merge” window:
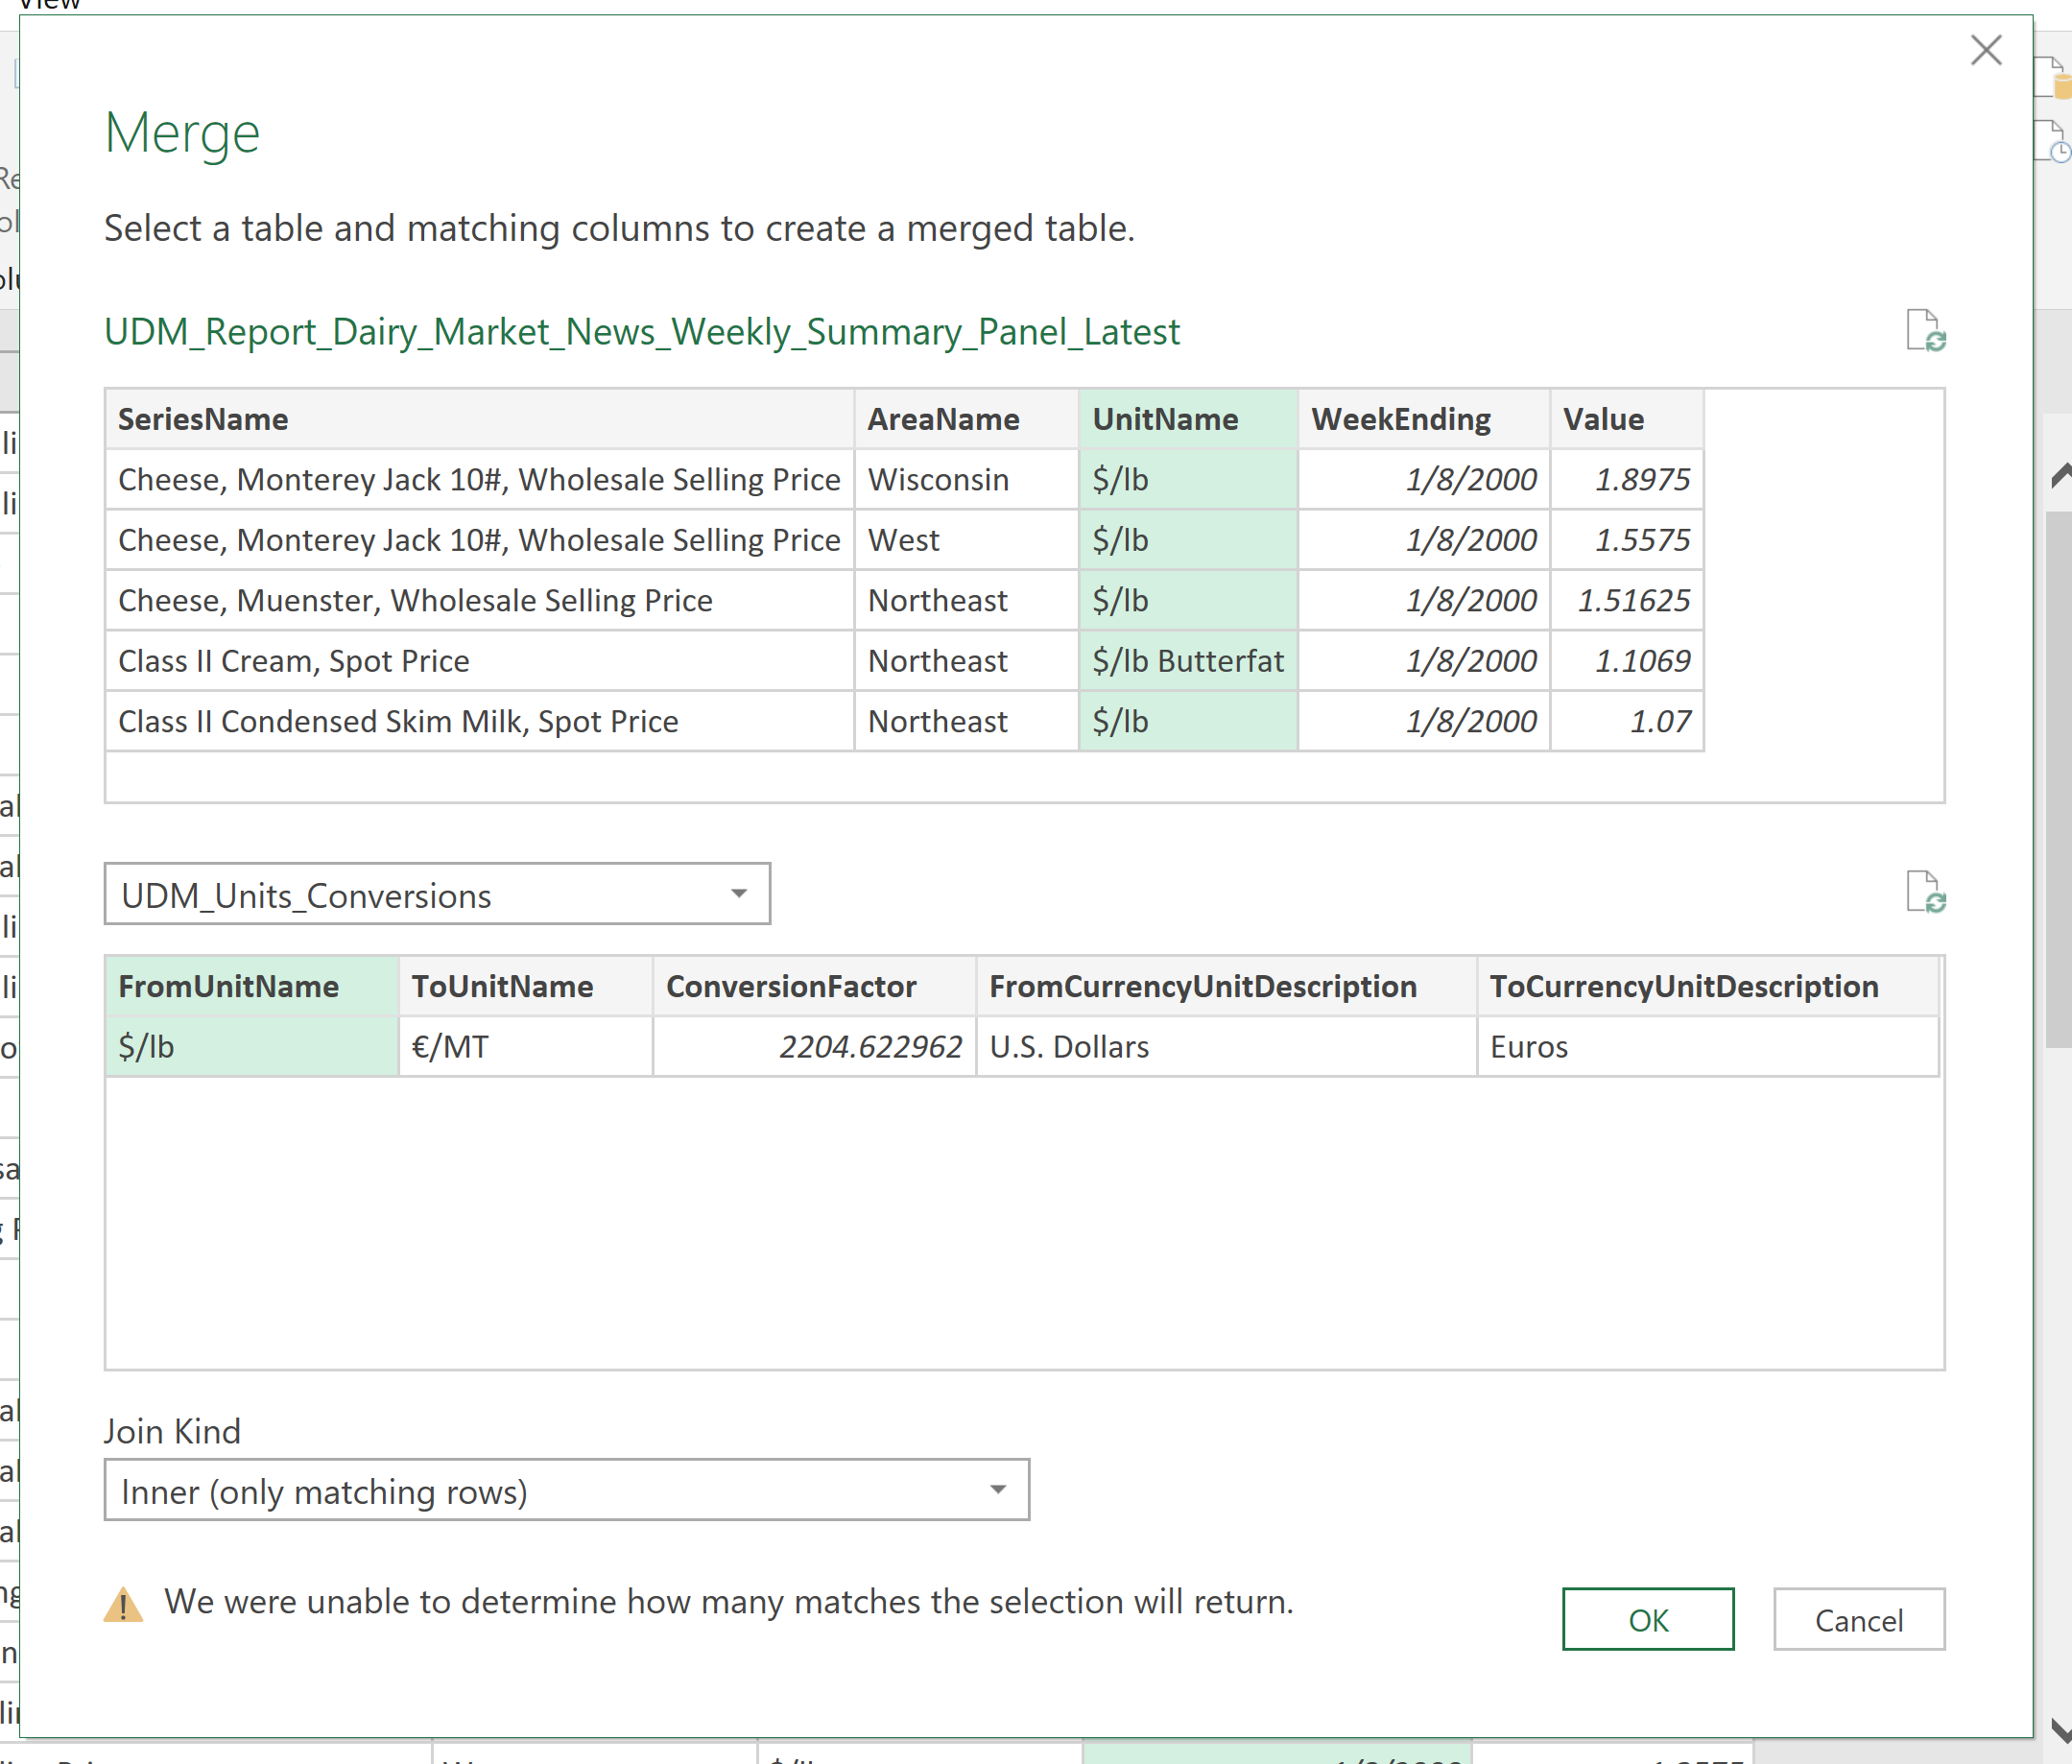
In the first table, select the column UnitName. Choose UDM_Units_Conversions for the second table, and select FromUnitName. Under Join Kind choose Inner (only matching rows) and click OK. A new column “UDM_Units_Conversions” will be added to your table. Click on the icon in the right corner of the column header to choose which columns to import from UDM_Units_Conversions:
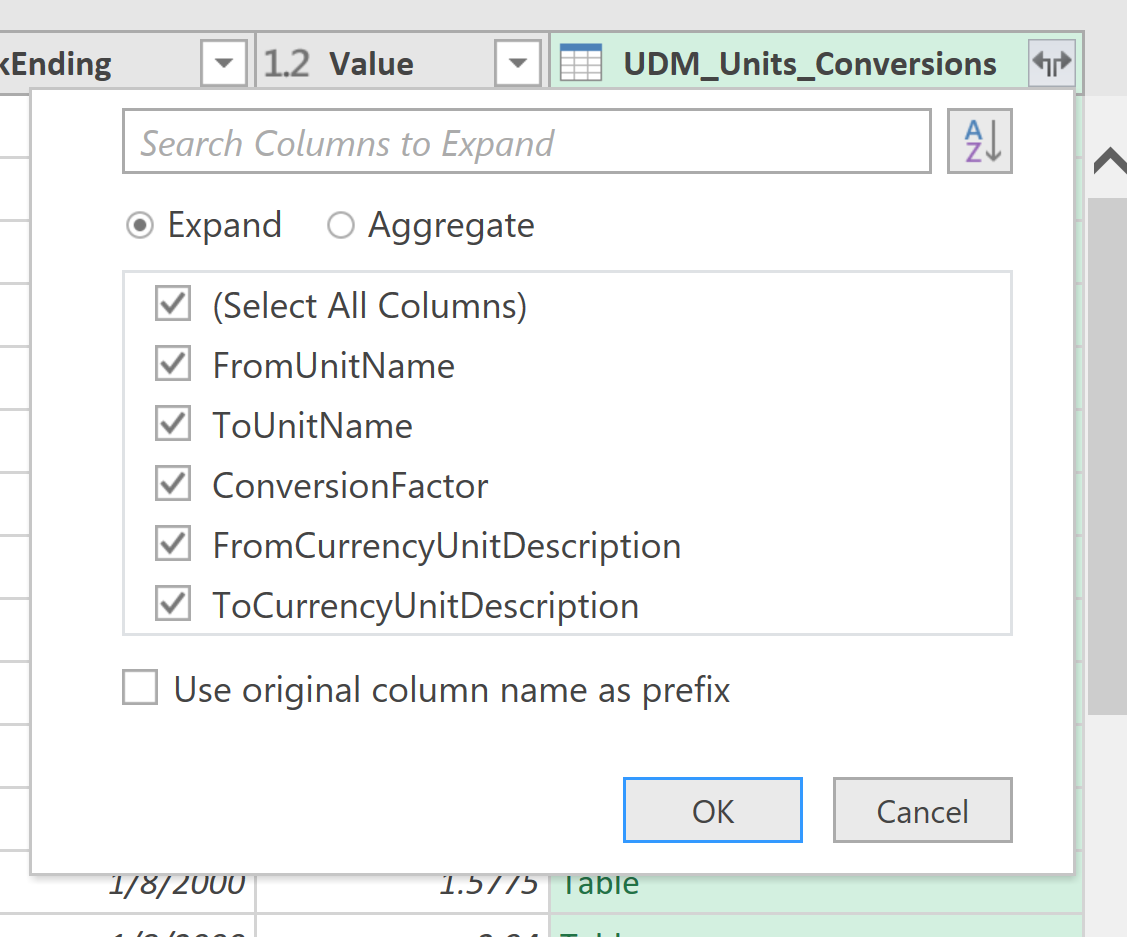
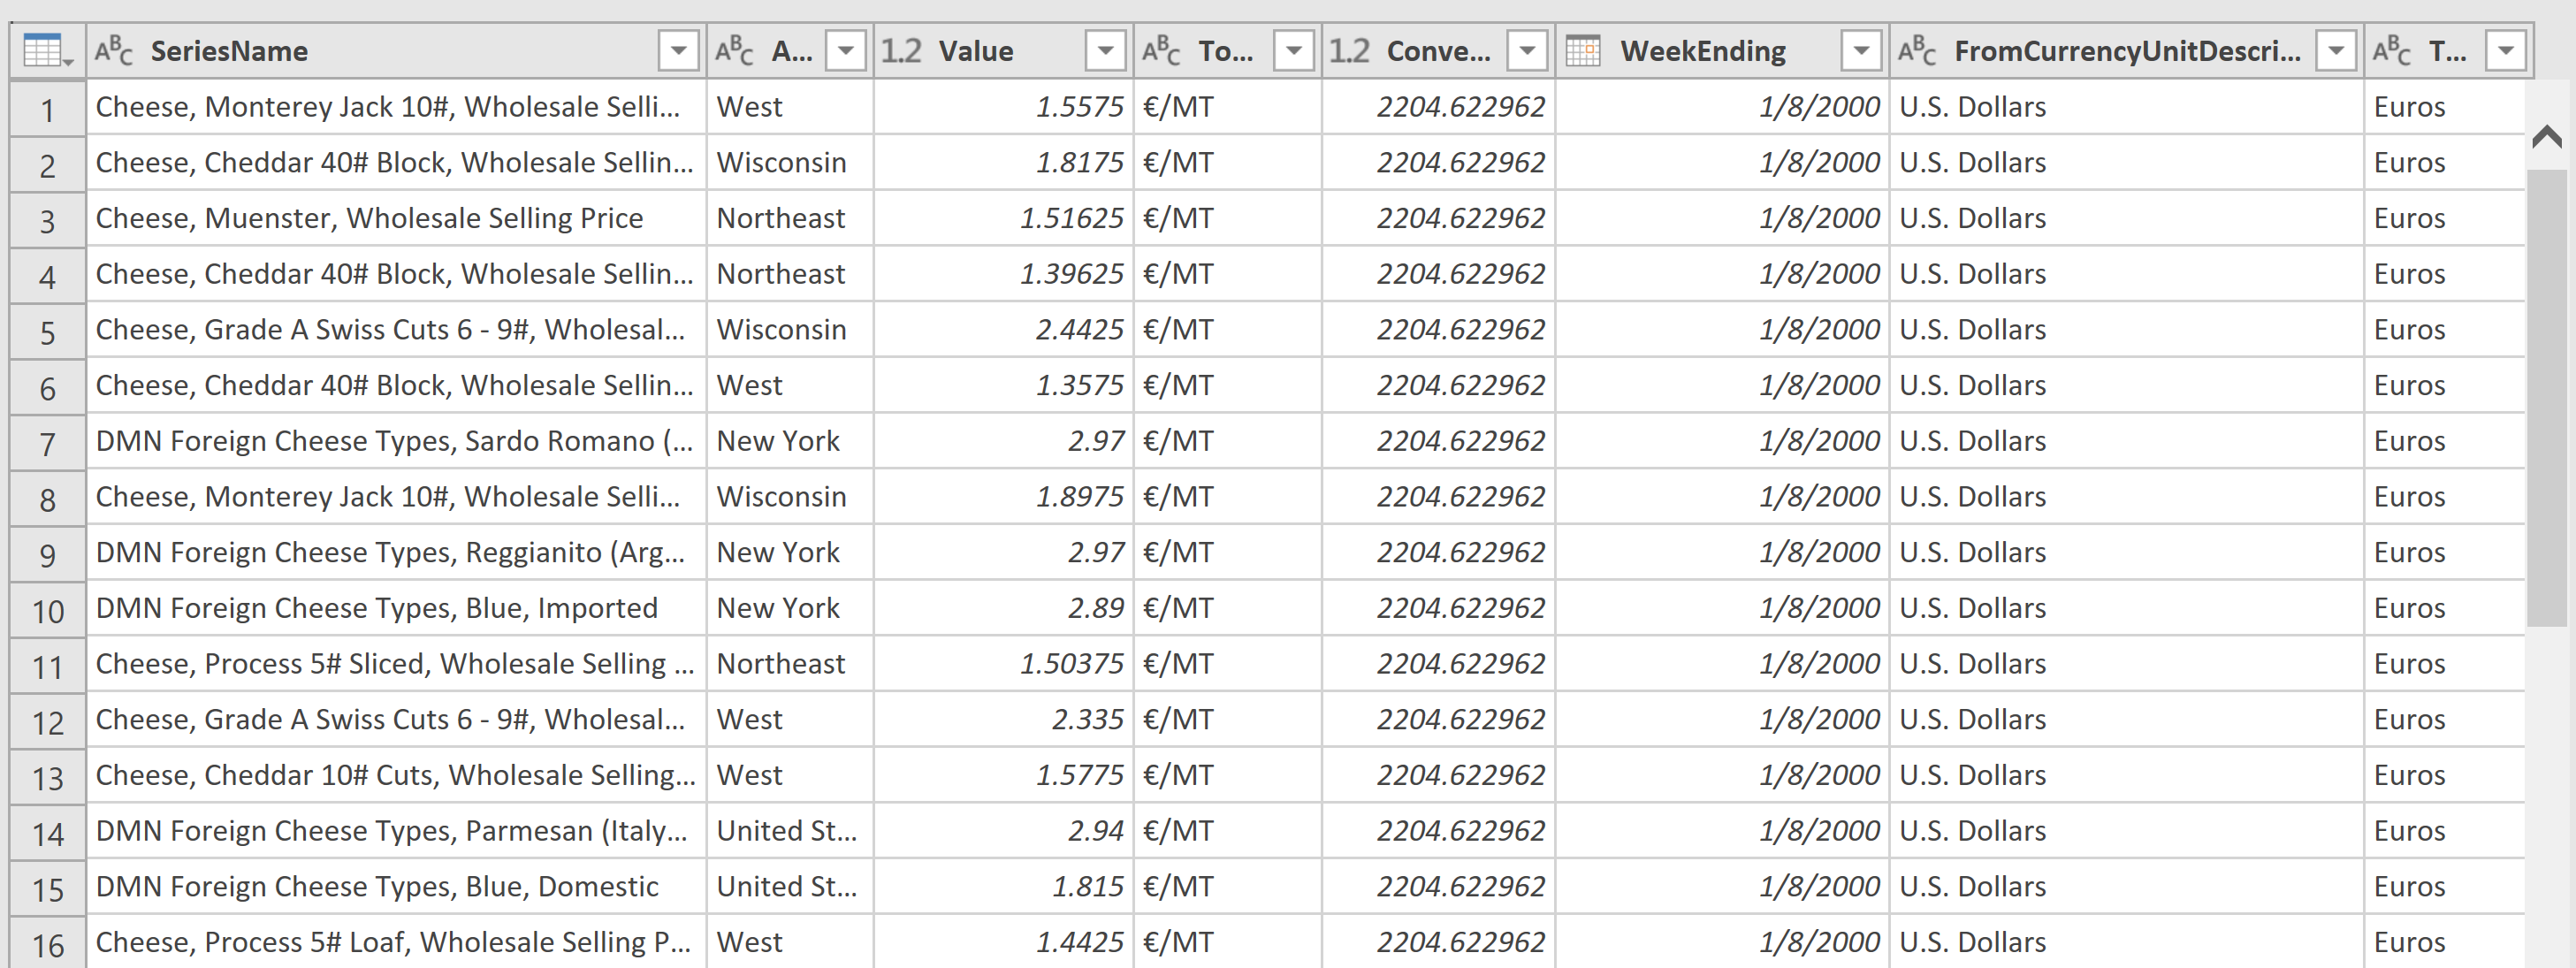
Keep all columns selected, but deselect “Use original column name as prefix”. Click OK. Now we have a table with five new columns. We can remove columns UnitName and FromUnitName. For convenience in the next step, move WeekEnding after the ConversionFactor. After cleaning up, your table should look like this:
In the next step, we will again merge this table, but this time with UDM_Report_Currency_Exchange_Rates_Weekly_Panel_Latest.
Step 5. Merge with UDM_Report_Currency_Exchange_Rates_Weekly_Panel_Latest
Click on Merge again.
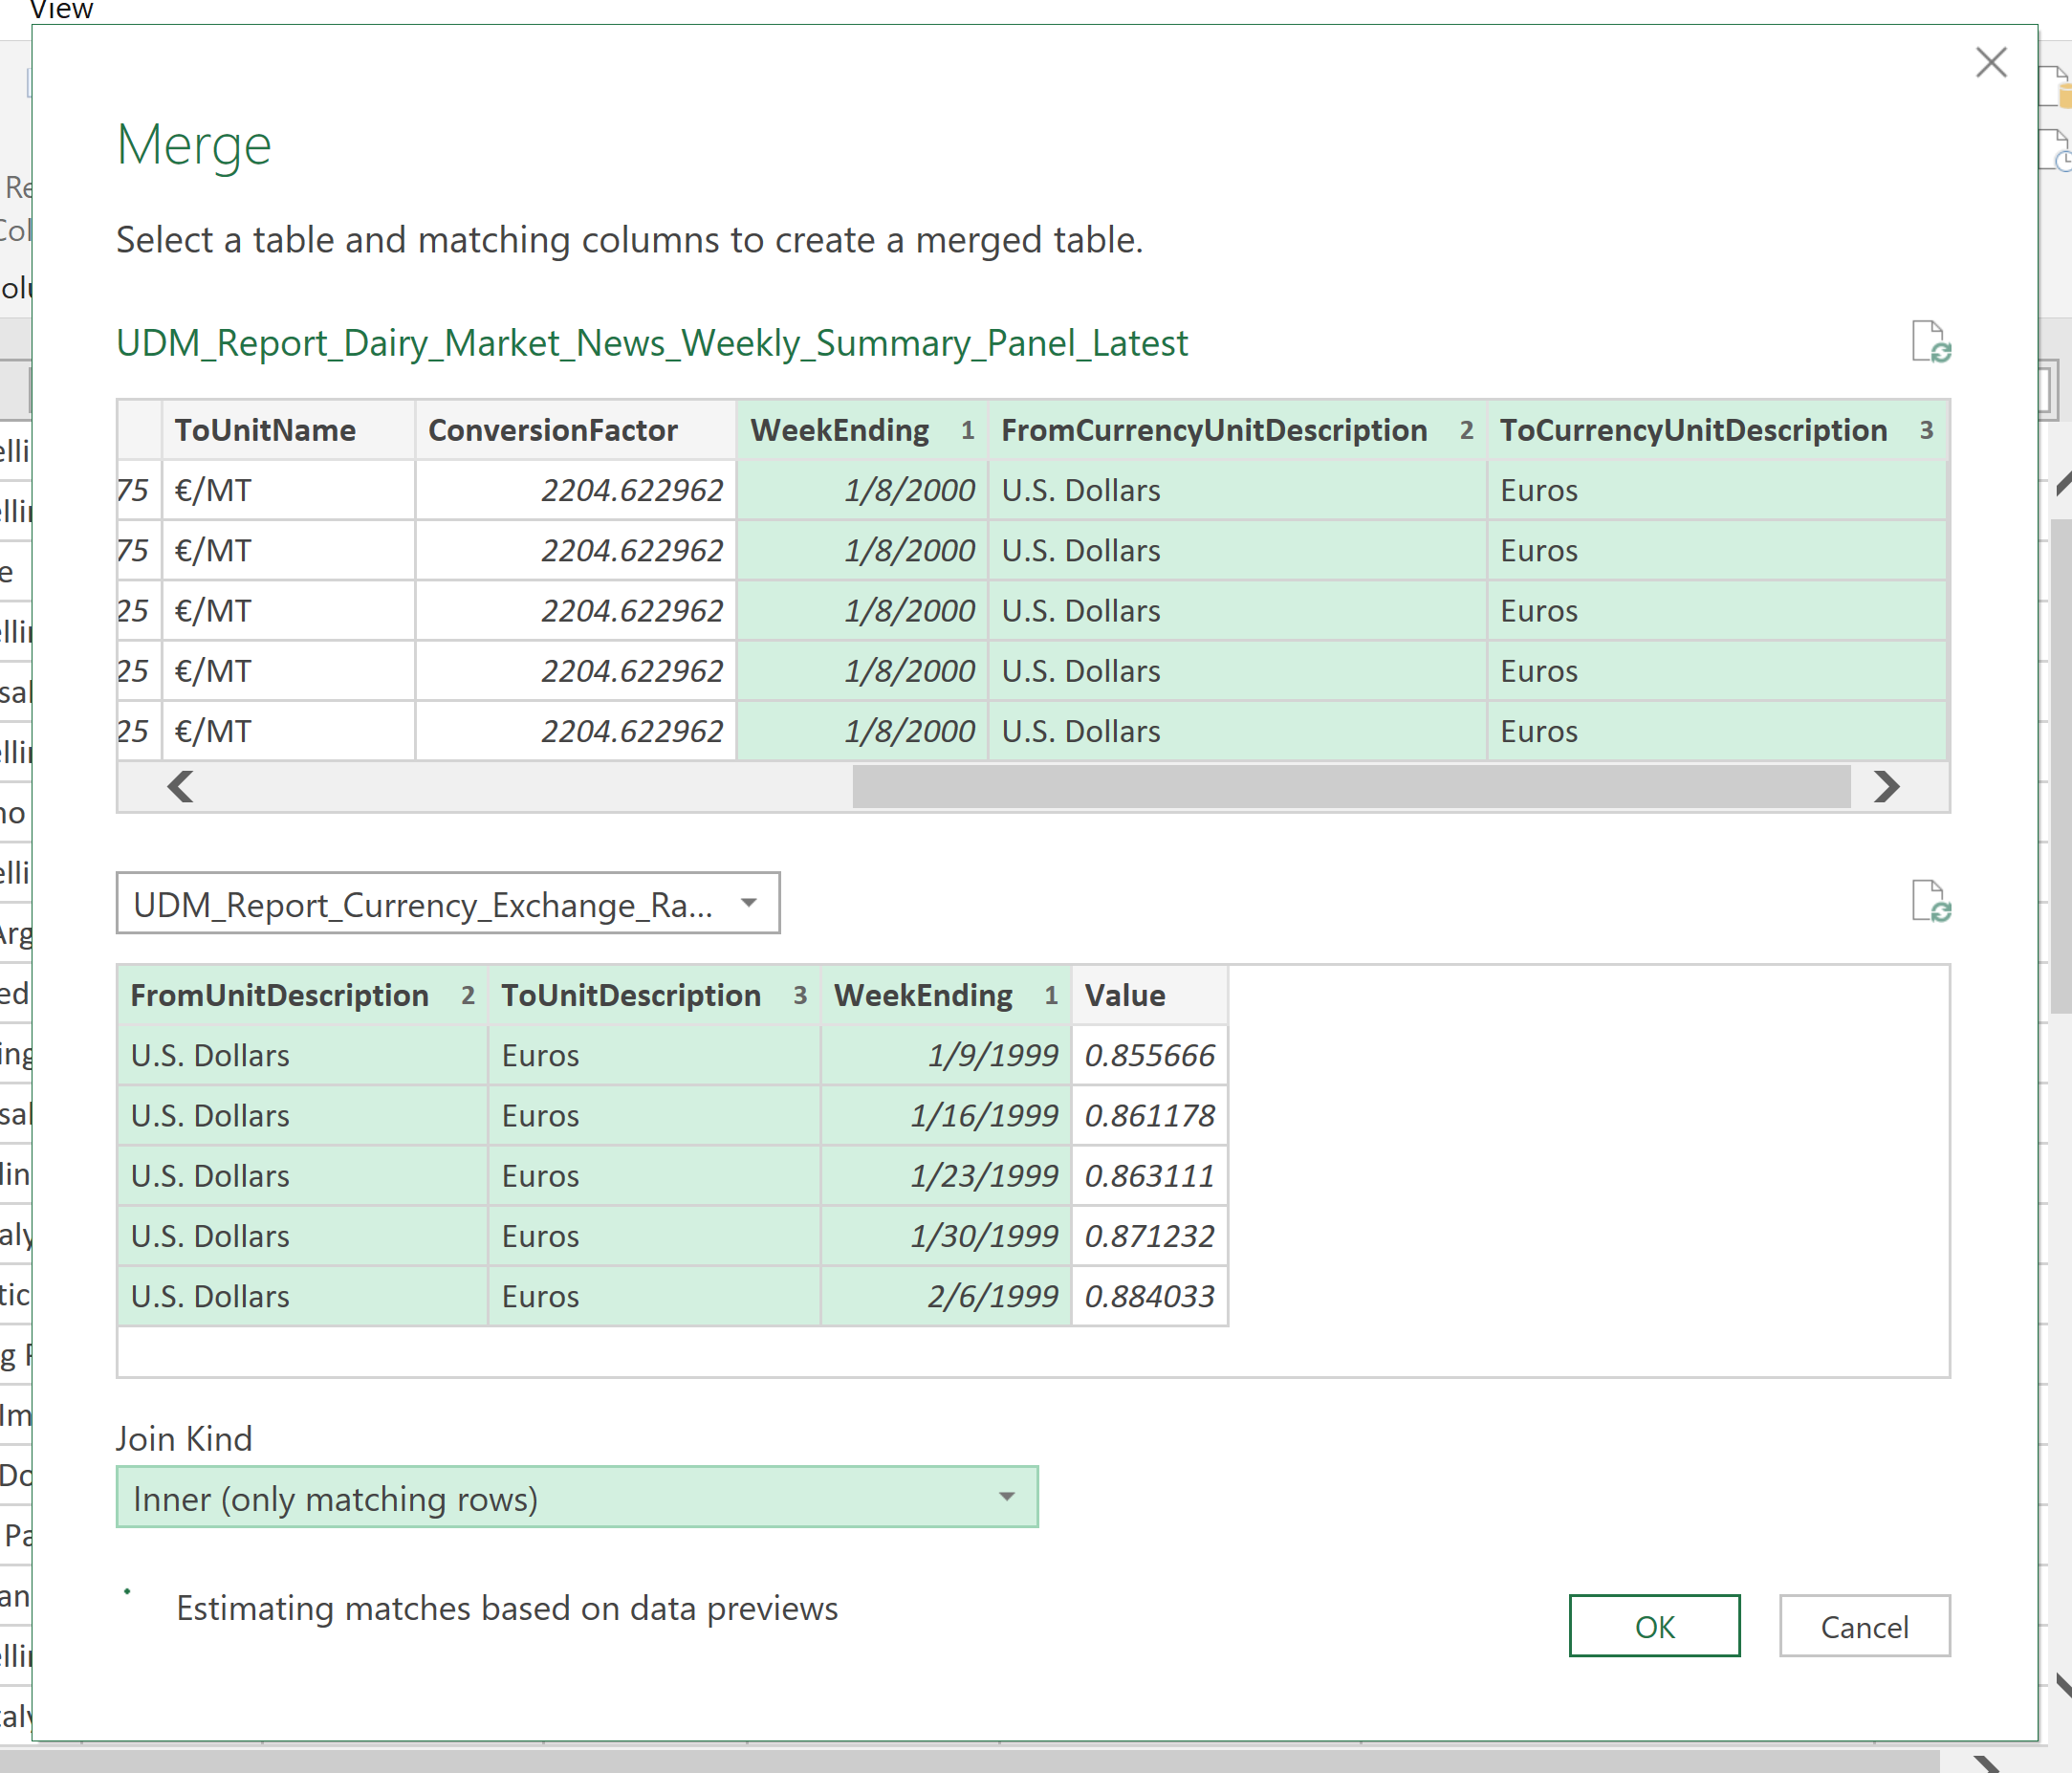
We will merge these tables on three columns, instead of just one like for UDM_Units_Conversions. In the top table, first select WeekEnding. Press and hold Ctrl button on your keyboard, then click on FromCurrencyUnitDescription, and then click on ToCurrencyUnitDescription. Select UDM_Report_Currency_Exchange_Rates_Weekly_Panel_Latest as the second table, and select WeekEnding, FromUnitDescription and ToUnitDescription – in that order – for merge columns. Join kind is Inner.
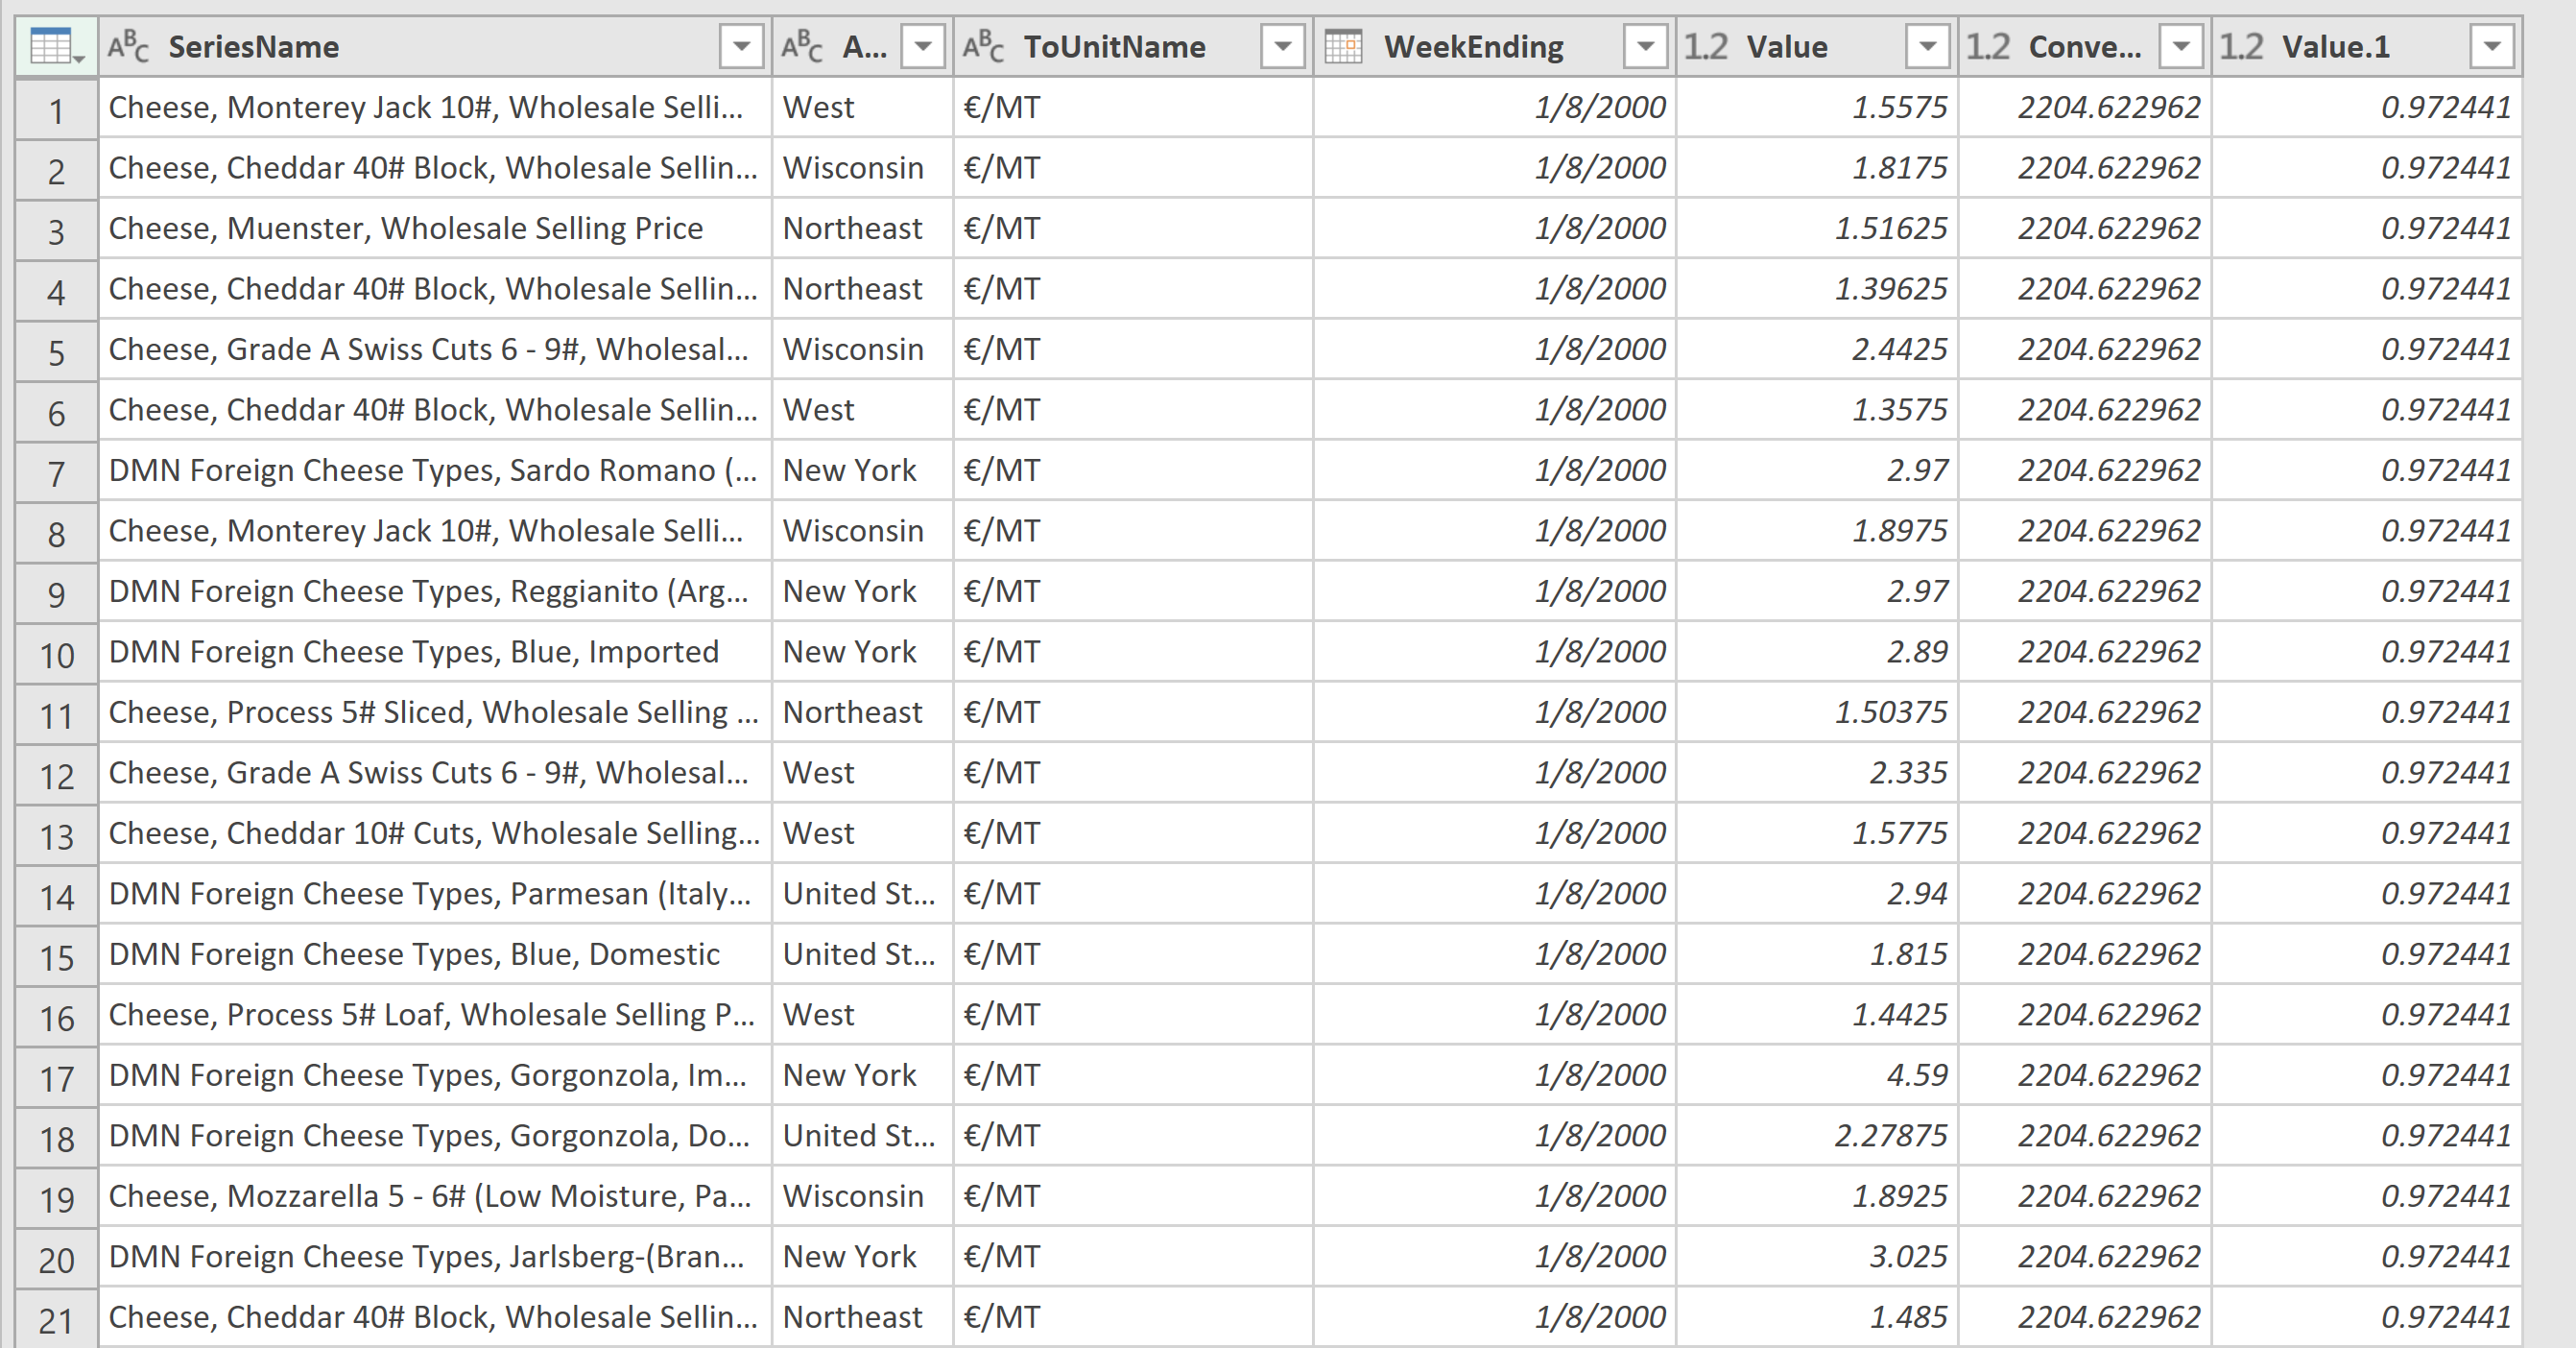
Click OK. Expand the newly added column in the same fashion as before. Click on the icon on the right end of the column header of the newly added column UDM_Report_Currency_Exchange_Rates_Weekly_Panel_Latest. Upon confirming that all merge columns match, you can remove columns: WeekEnding.1, ToUnitDescription, FromUnitDescription, ToCurrencyUnitDescription, and FromCurrencyUnitDescription. Move the ToUnitName column after AreaName, and WeekEnding after ToUnitName. The new table should look like this:
The last three columns contain: Value – original data, ConversionFactor – number needed to convert lb to MT, and exchange rate – the value of one U.S. dollar in Euros. To obtain the value of dairy commodities in Euros per metric ton, we need to multiply these three columns. Select all three columns: select the first one, press and hold Ctrl, then select the other two.
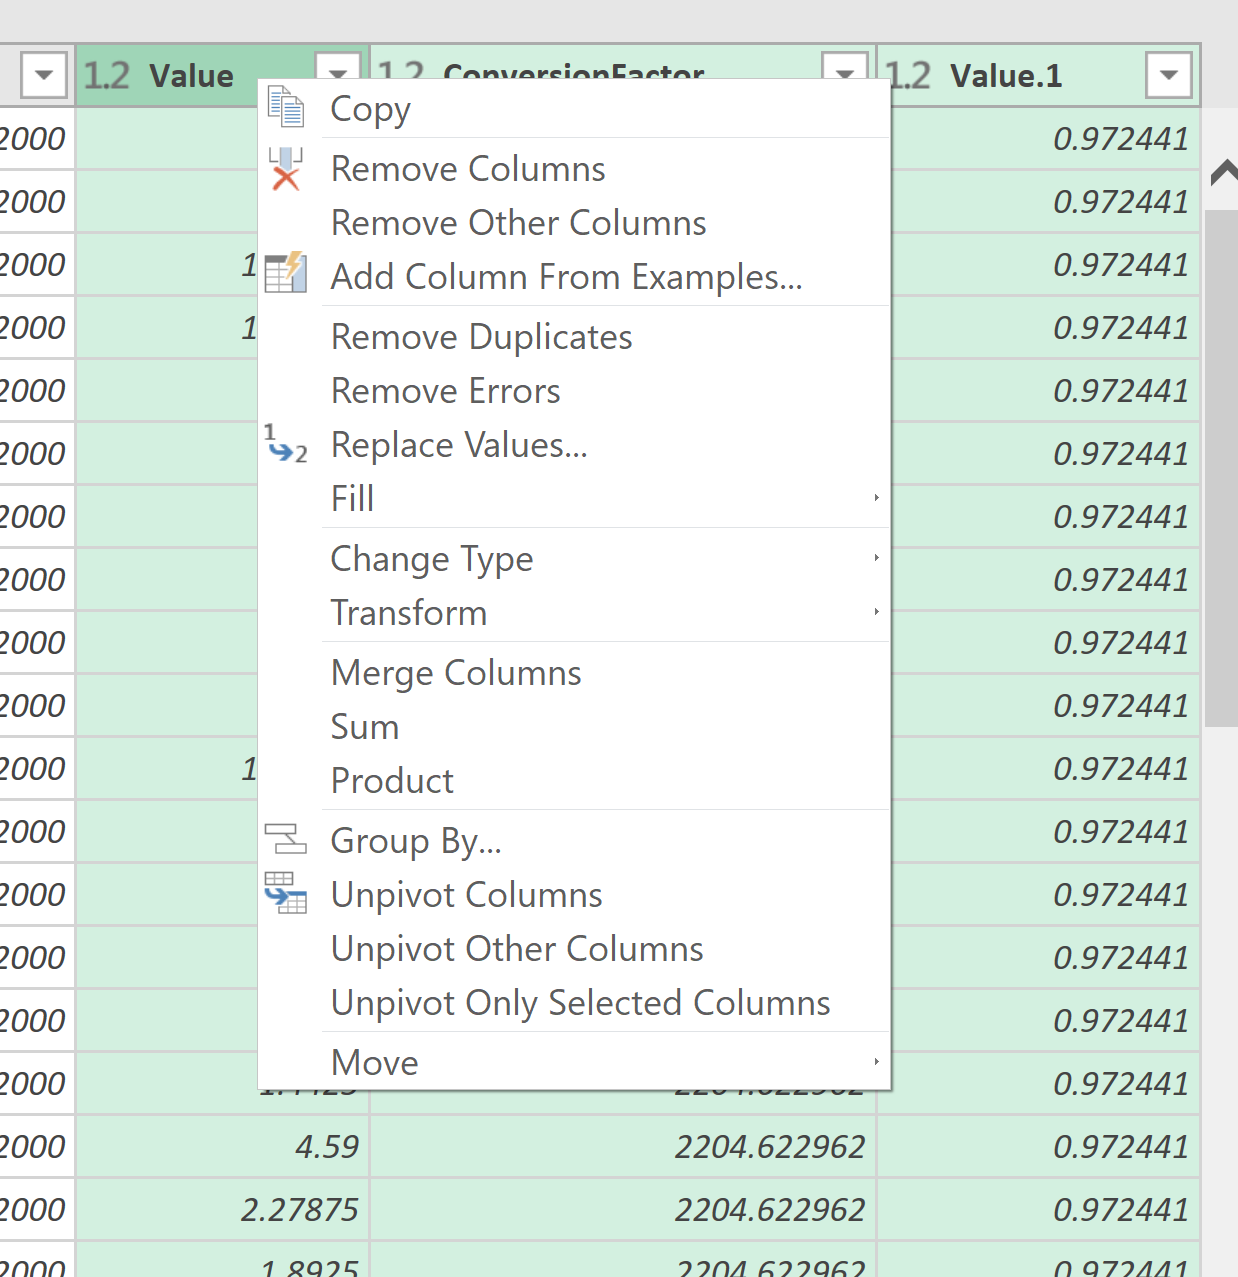
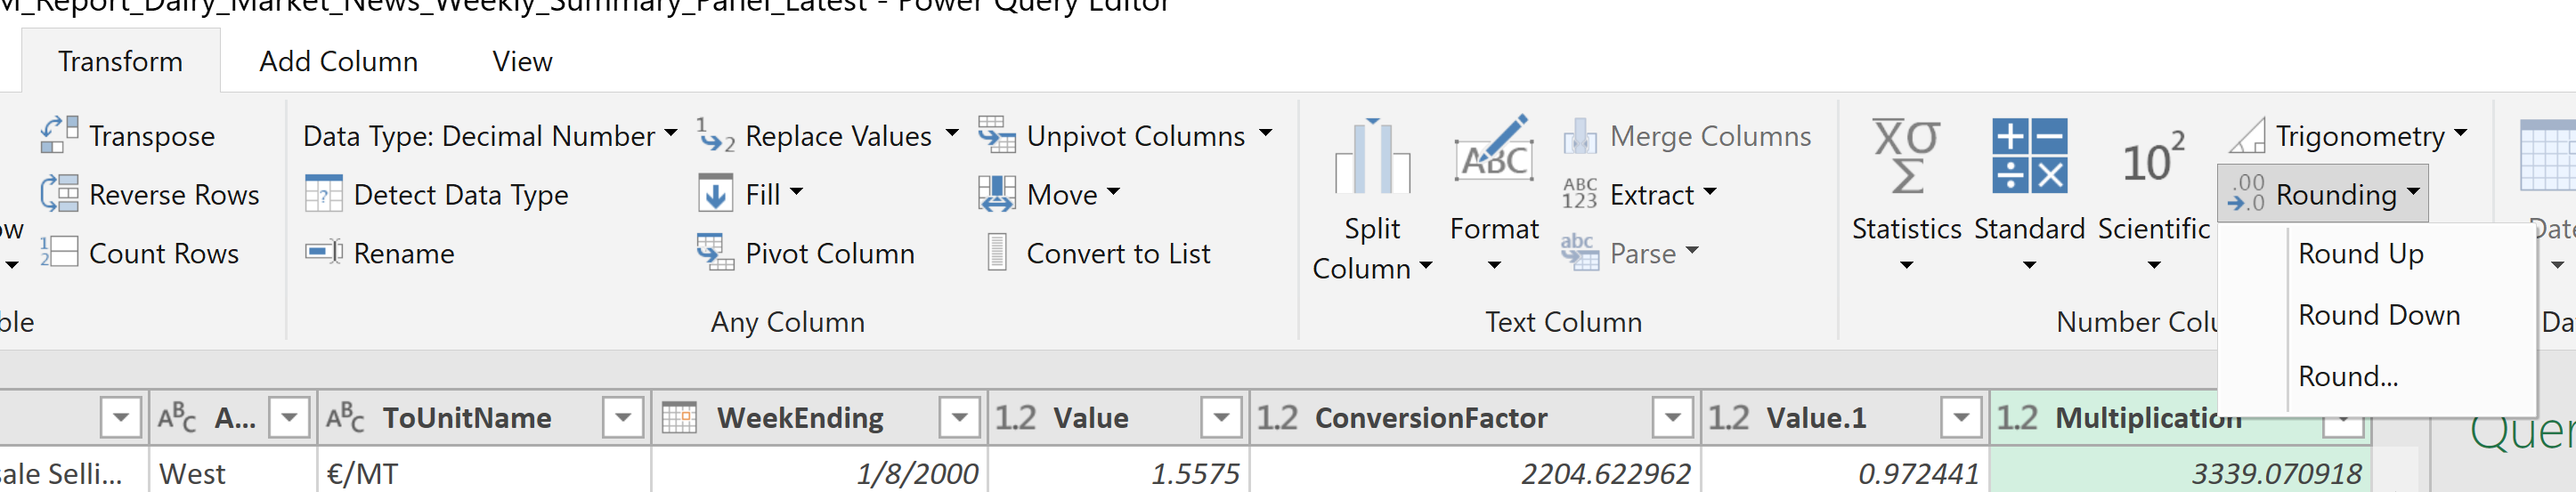
Click on Product to multiply values in each row. A new column titled Multiplication is added, and the numbers in that column represent the prices in €/MT. We can remove other three columns. To round the price in €/MT in the top menu, under Transform tab, Number Column group, from Rounding menu choose Round…
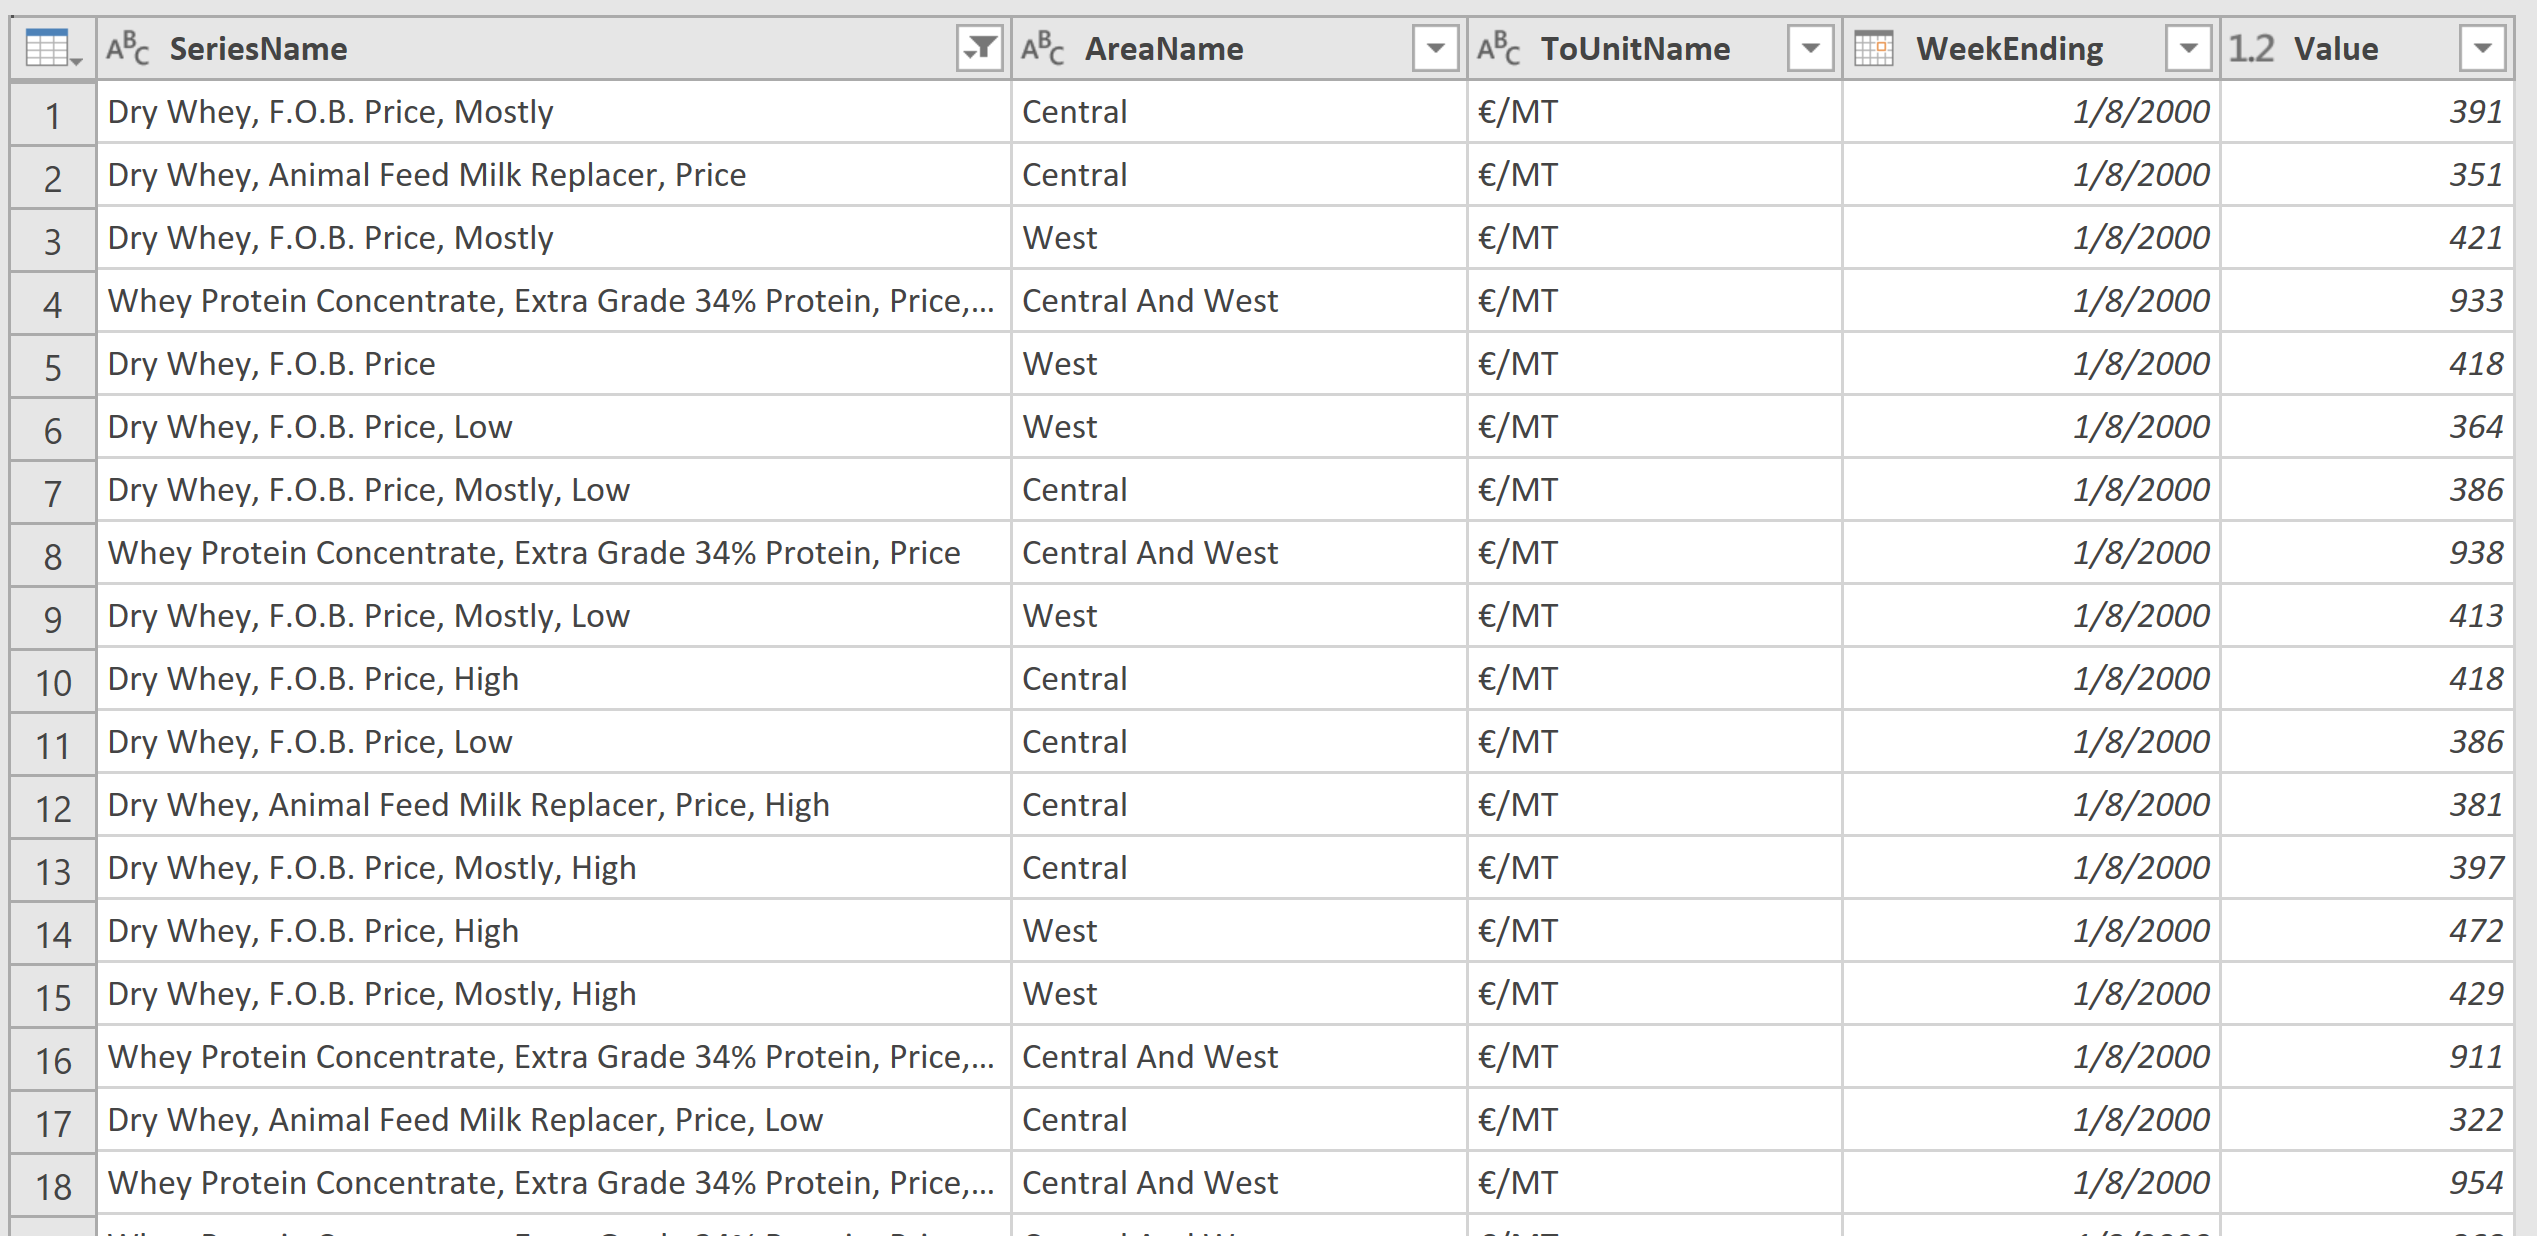
Round it to 0 decimal points. If you wish to use this table for pivot tables, or Power BI, no further changes are necessary. If you wish to convert the table so that each variable occupies a separate column, just like in UDM_Report_Dairy_Market_News_Monthly, then a few additional steps are needed. Here we will assume we are only interested in whey-related series. Left-click on the icon at the right end of the SeriesName column header, and choose whey series of interest. Cleaned-up table now looks as following:
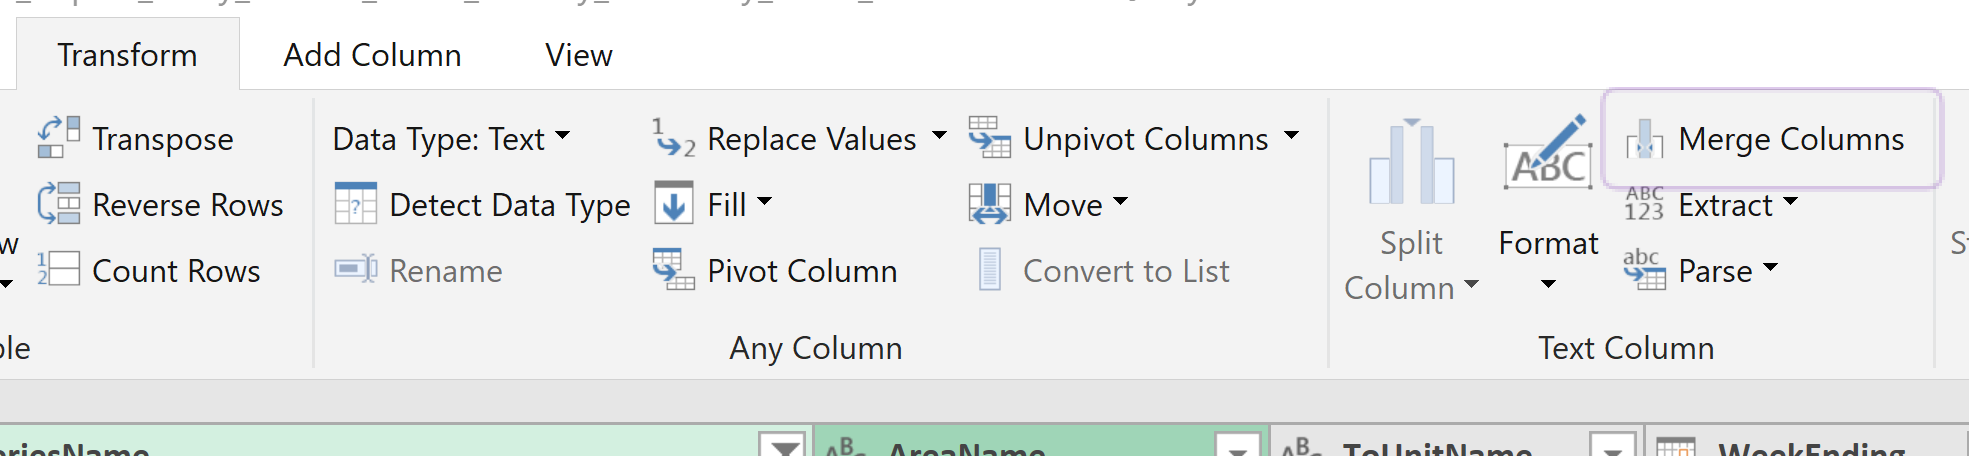
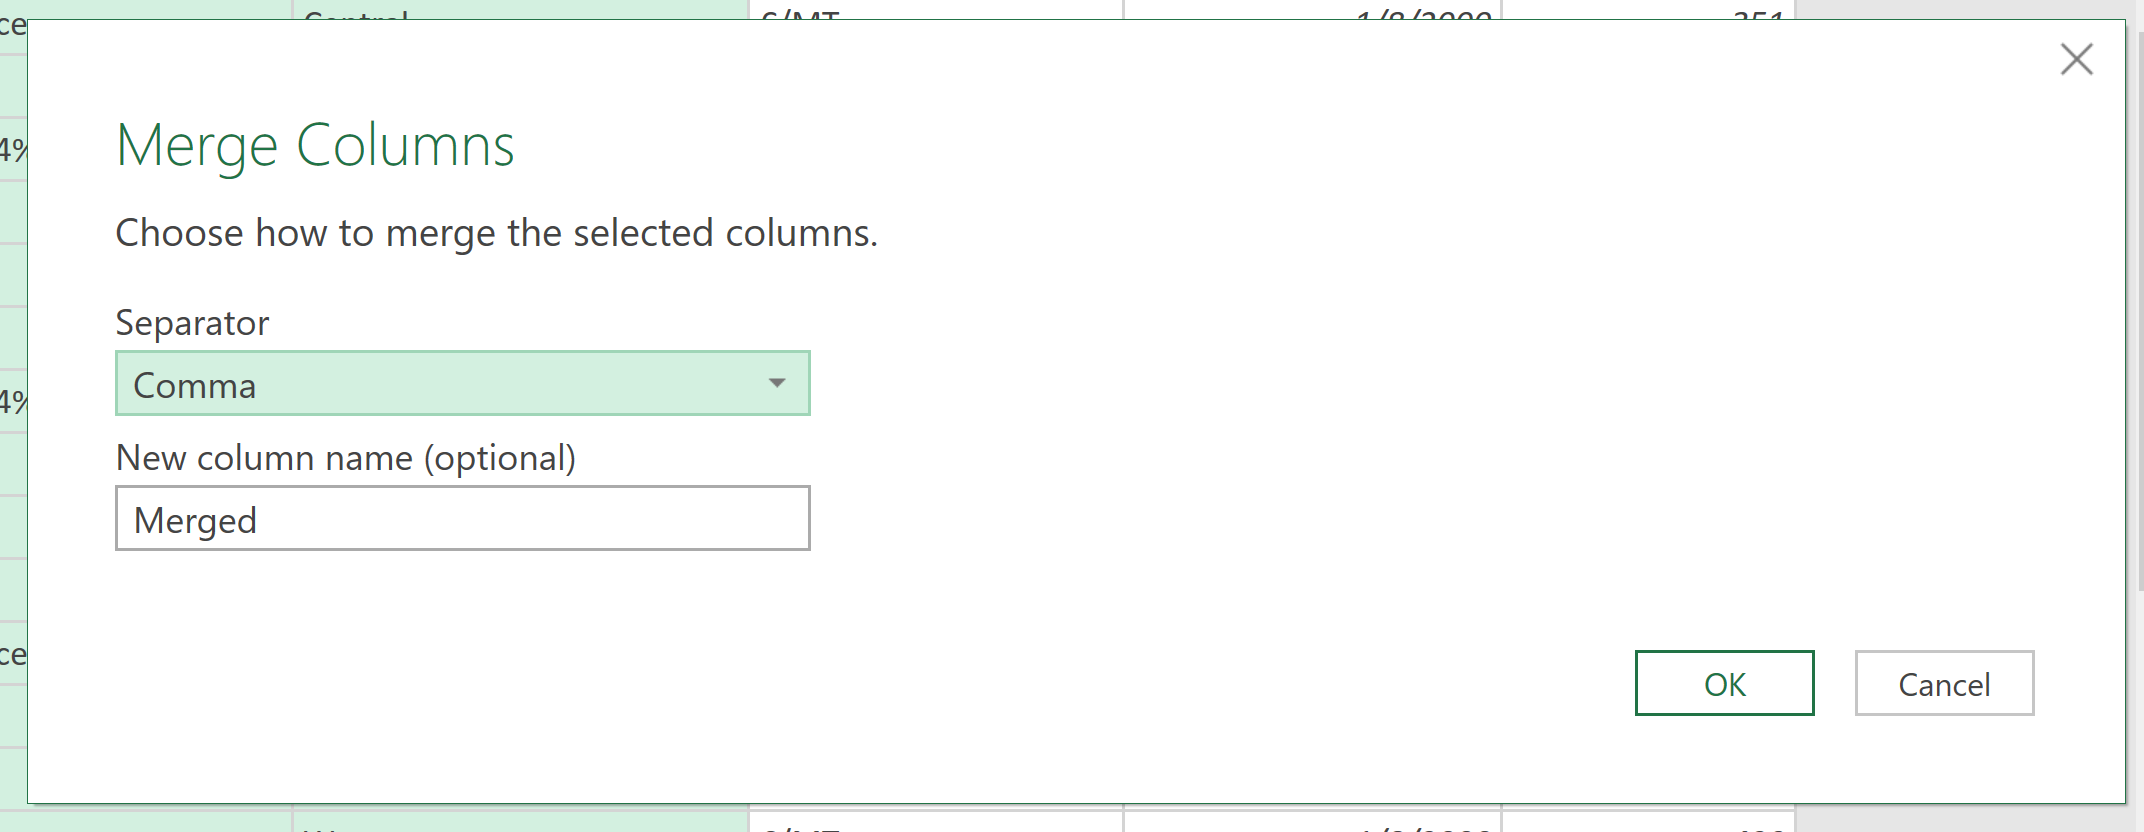
Next, we need to merge SeriesName and AreaName columns. Select SeriesName first, then AreaName. From the top menu tab Transform, group Text Column, select Merge Columns:
Choose Comma as the separator, or anything else you prefer. Click OK.
New column looks like this:
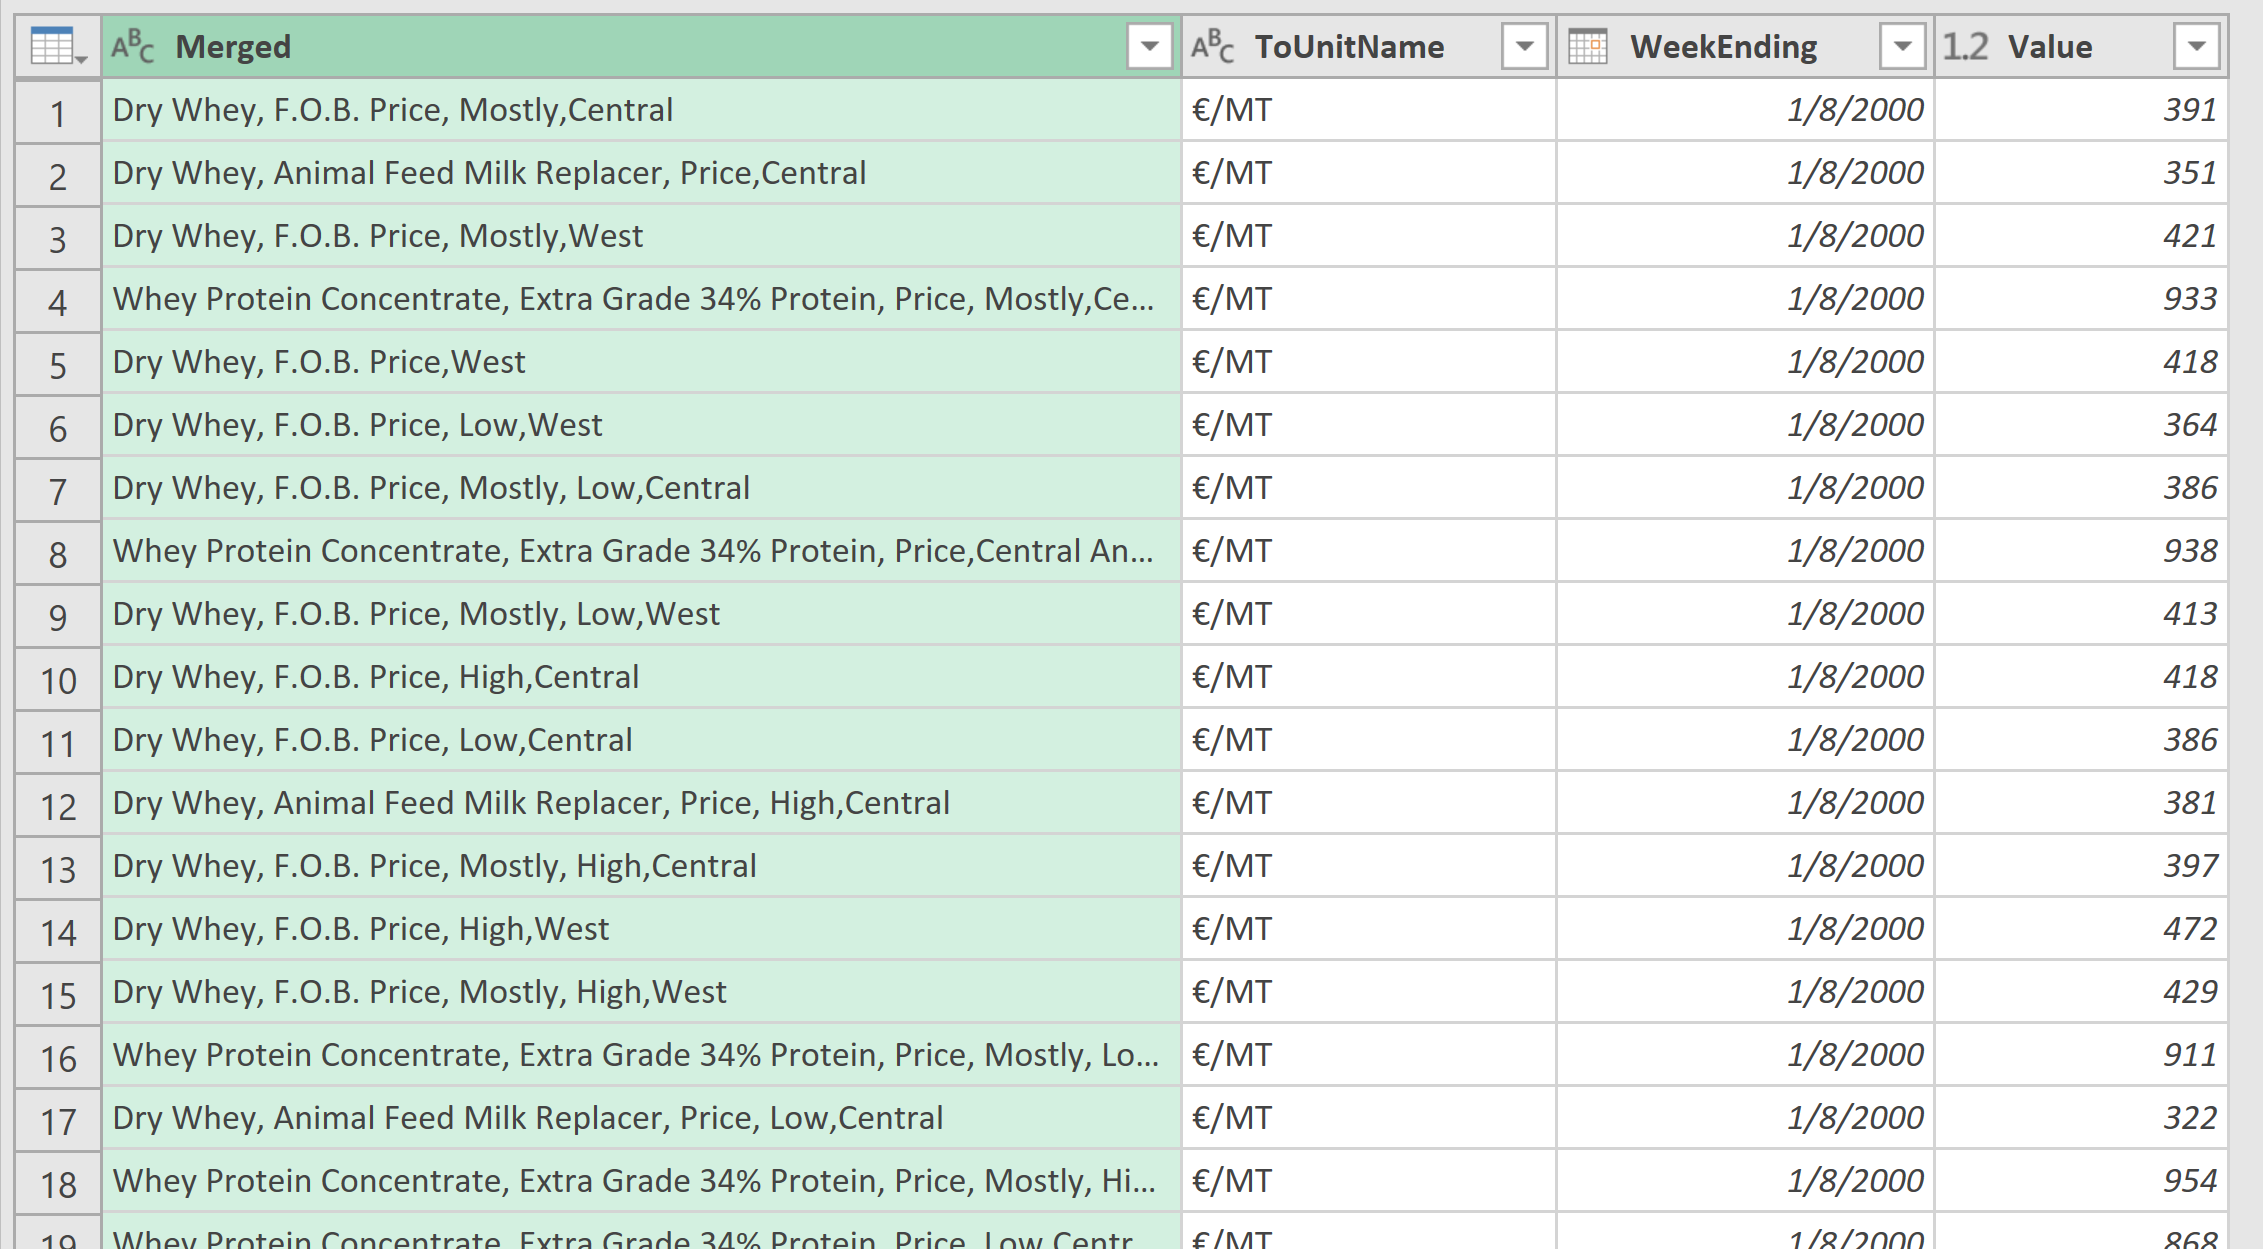
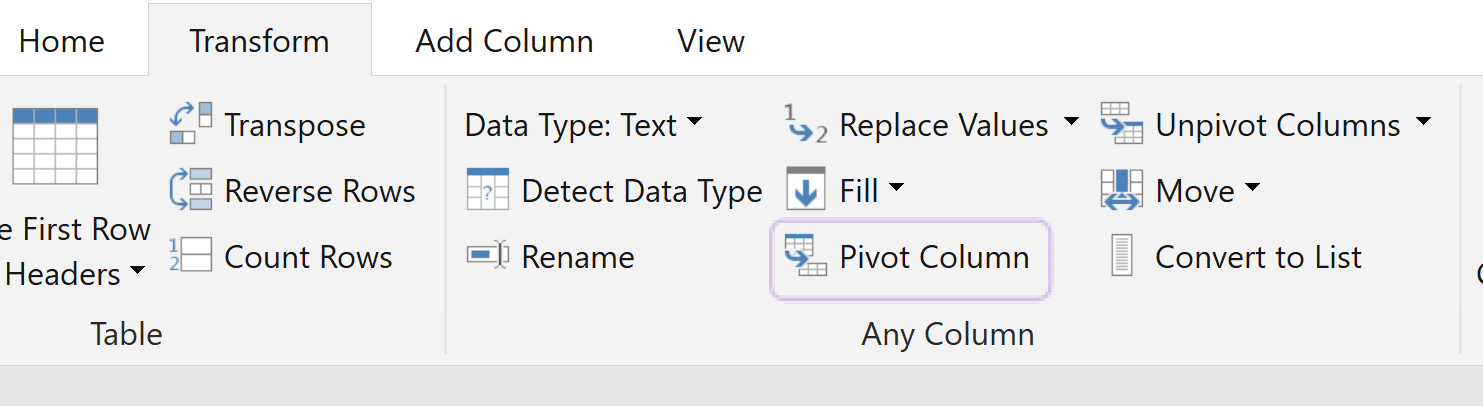
Remove the ToUnitName column. Then Select the Merged column, and from the Transform tab on the top-menu (not from the column-header menu), under Any Column group, choose Pivot Column:
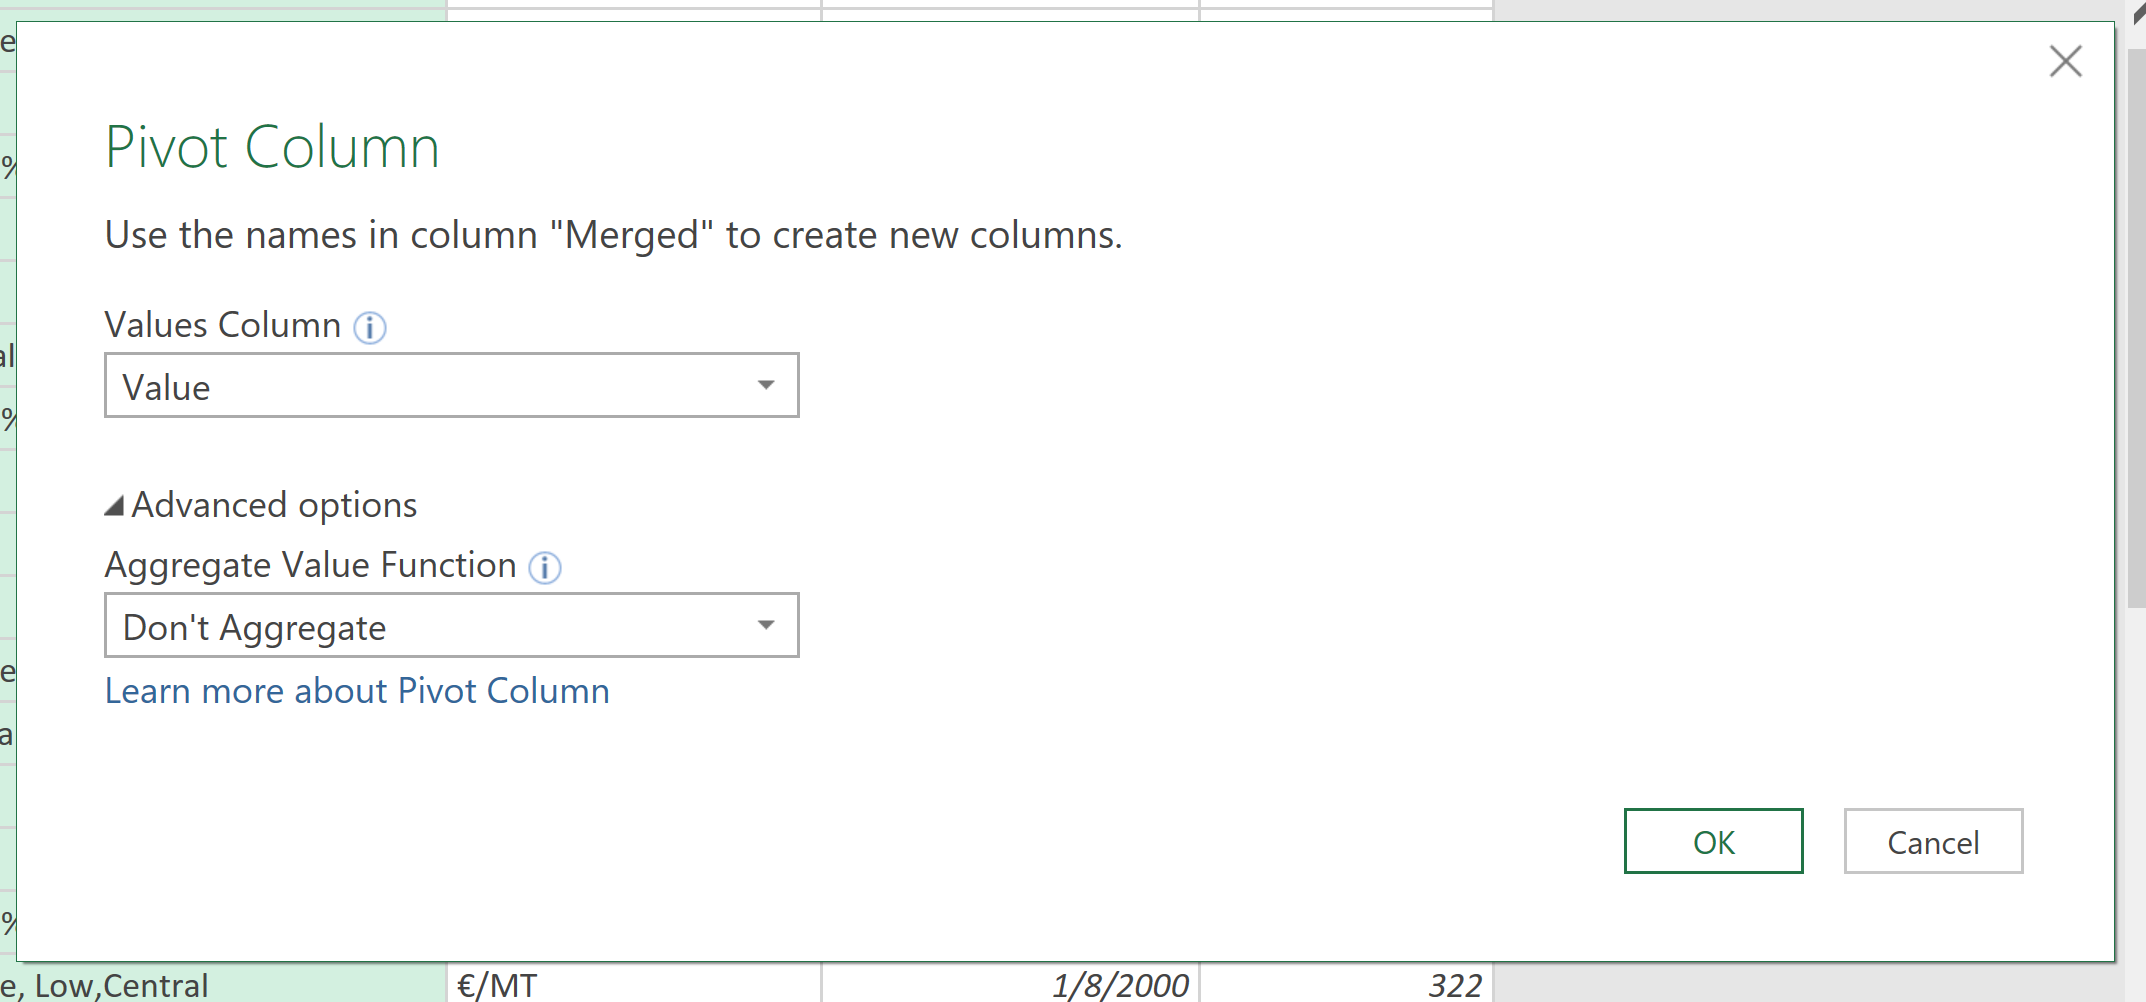
Choose Value as Values Column, and Don’t Aggregate as the option under Aggregate Value Function.
And we have our final table – series of interest are in separate columns, and WeekEnding is the first column. Final touch, Sort Descending the WeekEnding column, and Close & Load into Excel.
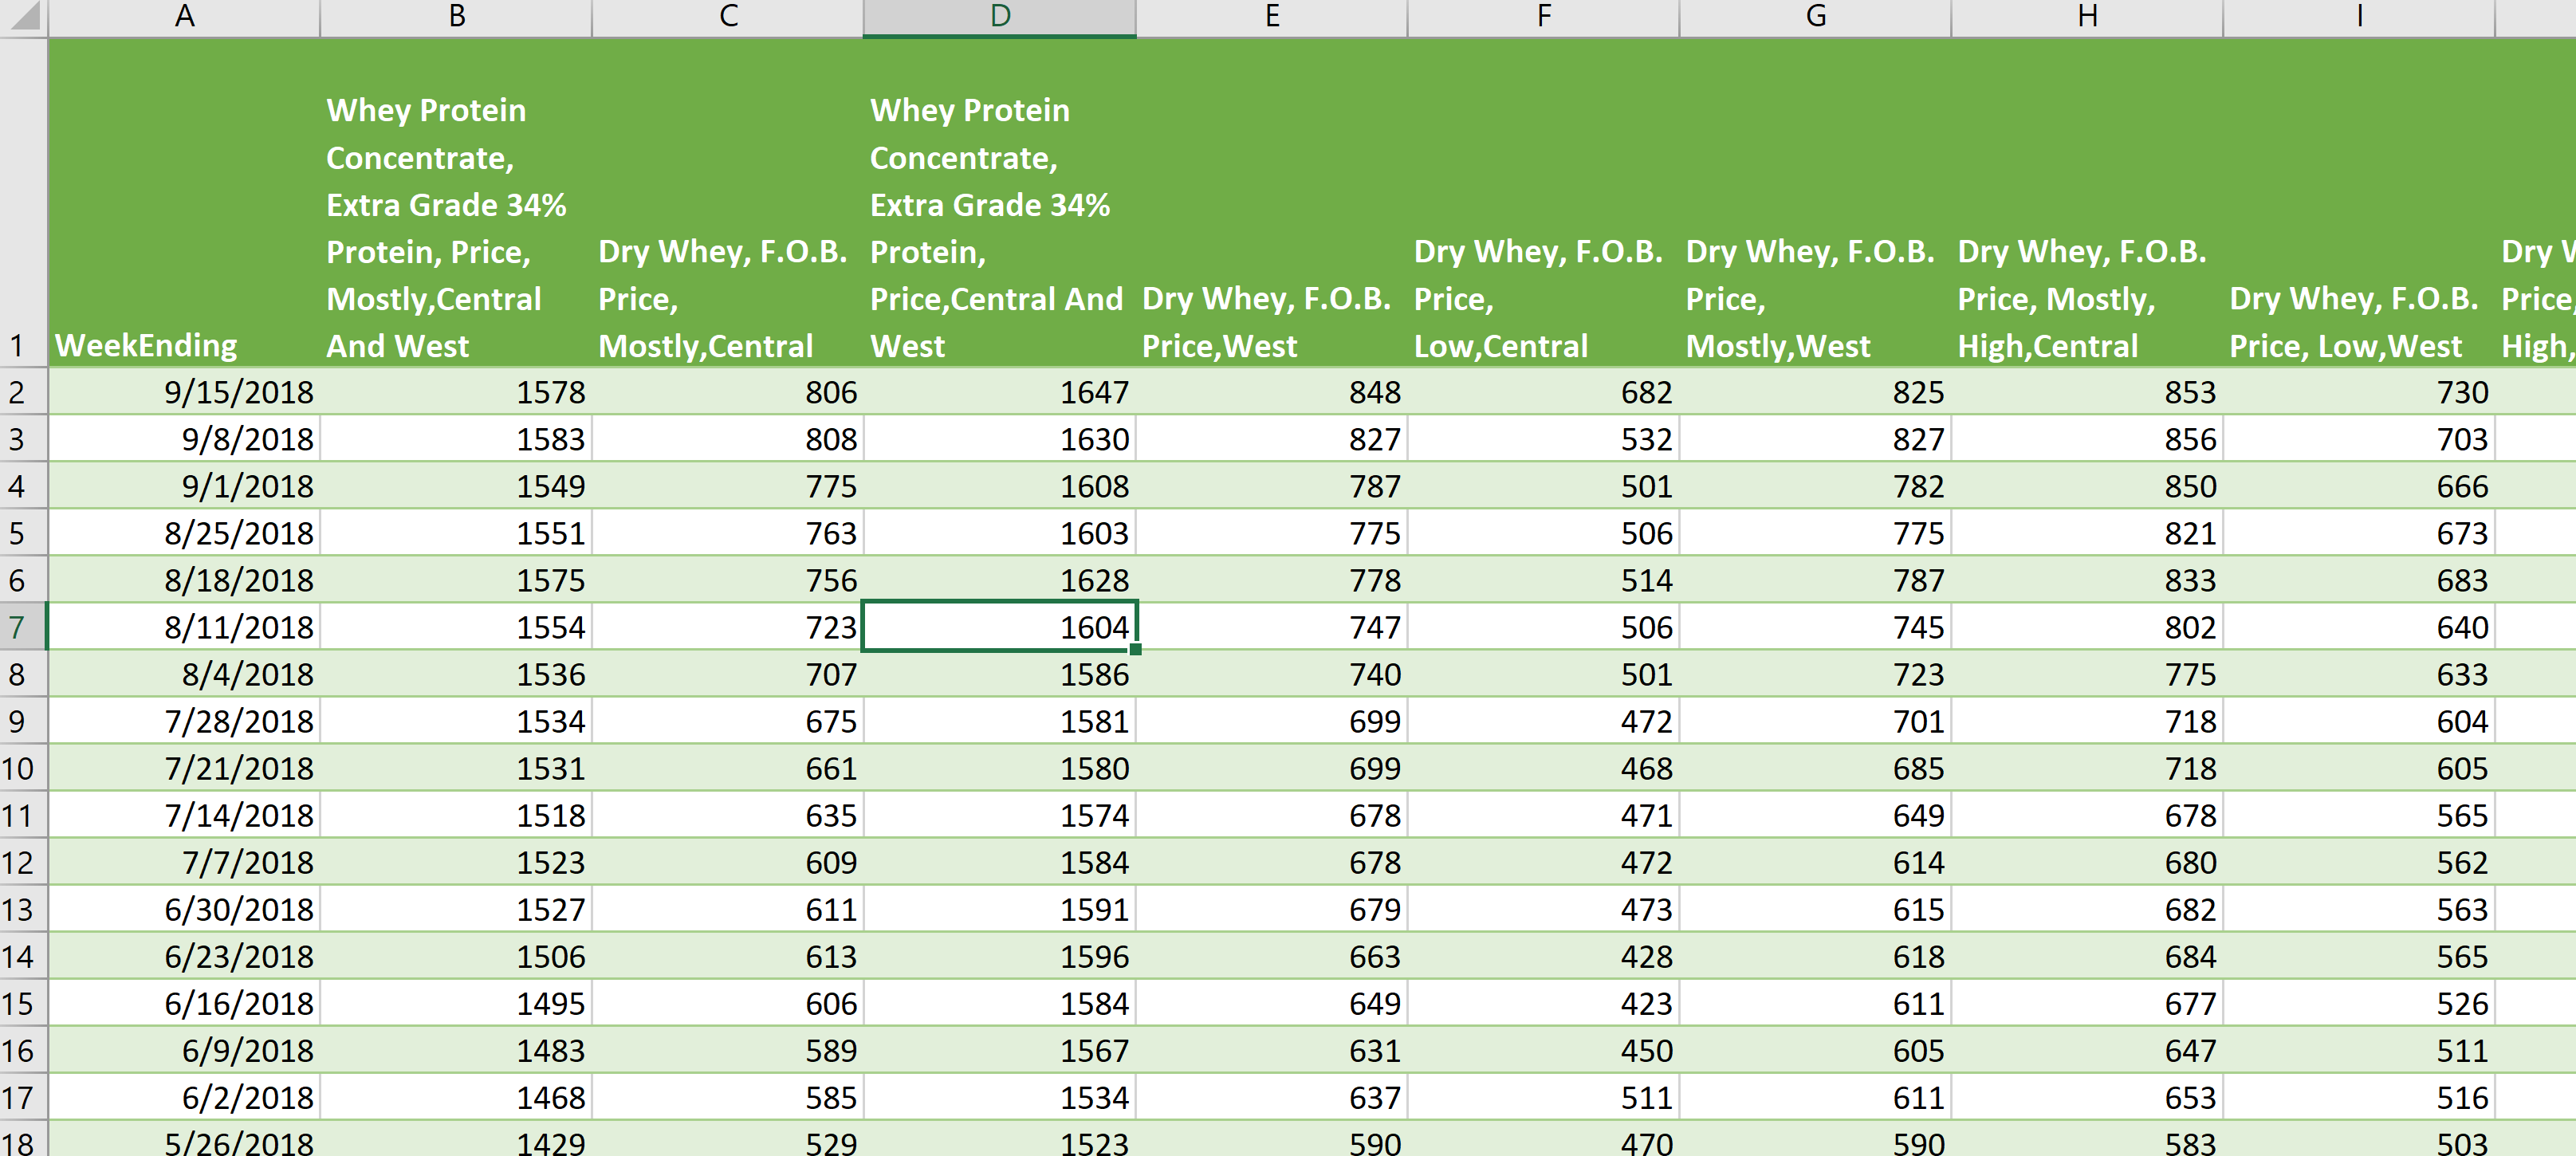
DMN weekly whey prices are now expressed as euros per metric ton! Congratulations on successfully completing this exercise!
Completed file: KB Example File – Changing Units, v20180922