UDMDirect is designed to support data access by Excel users, as well automated ETL data pulls for users who prefer to import data into their in-house database.
Data access for Excel Users
Tables designed for Excel users have names that start with UDM_Report_* or UDM_Custom_*. These tables are typically report-specific, i.e. there is typically a separate table for each major report in our database.
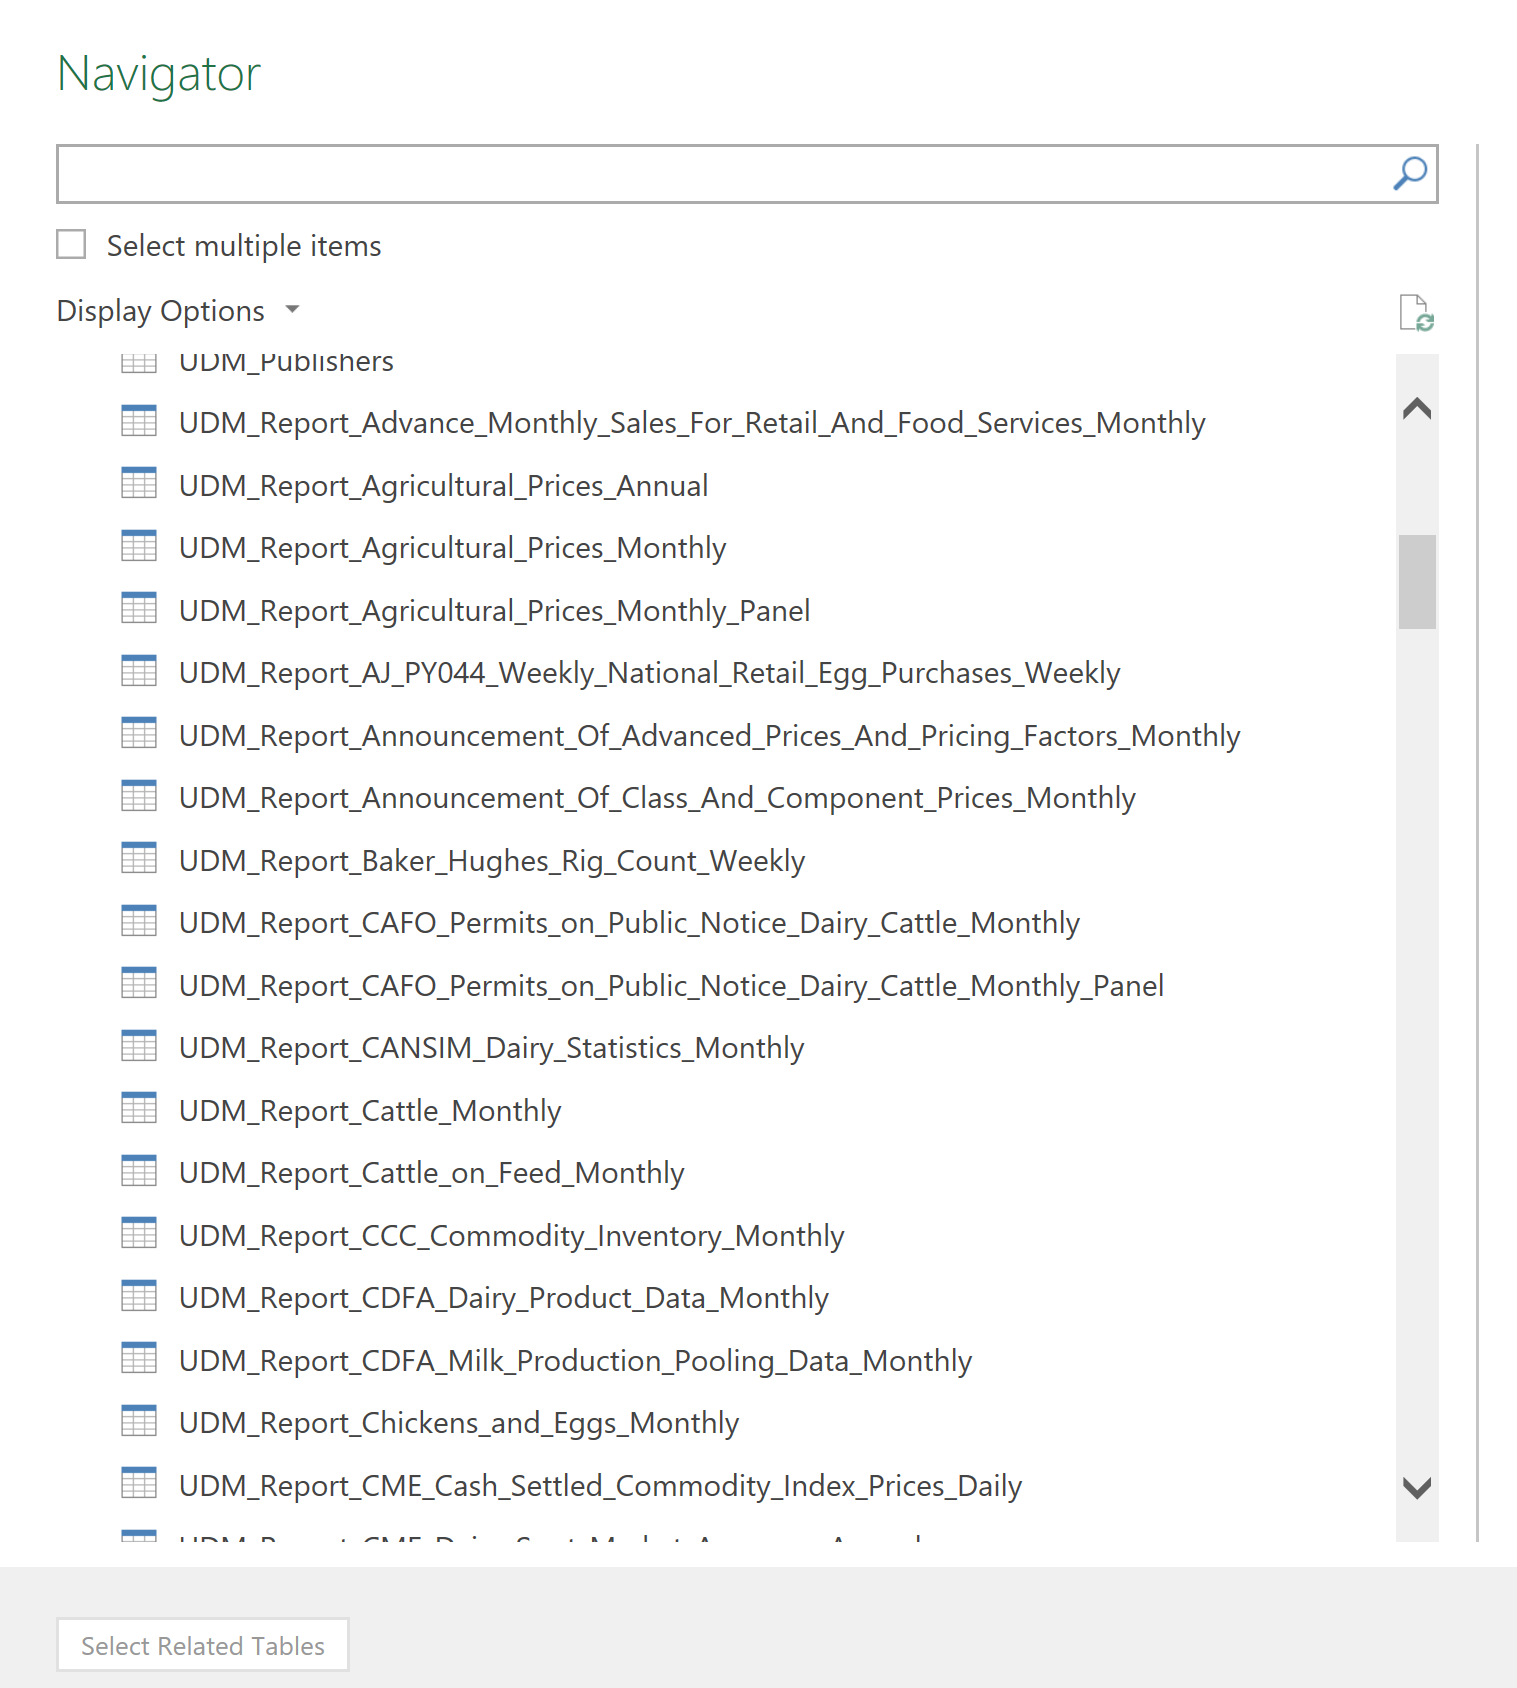
For example:
- UDM_Report_Cold_Storage_Monthly, for USDA NASS Cold Storage report.
- UDM_Report_National_Dairy_Products_Sales_Report_Weekly for USDA AMS National Dairy Products Sales Report.
- UDM_Report_Dairy_Australia_Milk_Production_Report_Monthly for Dairy Australia’s Milk Production report.
The word following the report name always signifies the data frequency. For example:
- UDM_Report_Milk_Production_Monthy – monthly data for U.S. and top 23 states from USDA NASS Milk Production report.
- UDM_Report_Milk_Production_Quarerly – quarterly data for all 50 U.S. states from USDA NASS Milk Production report, published in January, April, July and October.
- UDM_Report_Milk_Production_Annual – annual data on U.S. and states’ milk production from USDA NASS Milk Production.
Frequencies are: Daily, Weekly, Monthly, Quarterly and Annual.
In regular tables, each column is a separate time series, as seen below for UDM_Report_Milk_Production_Monthly:
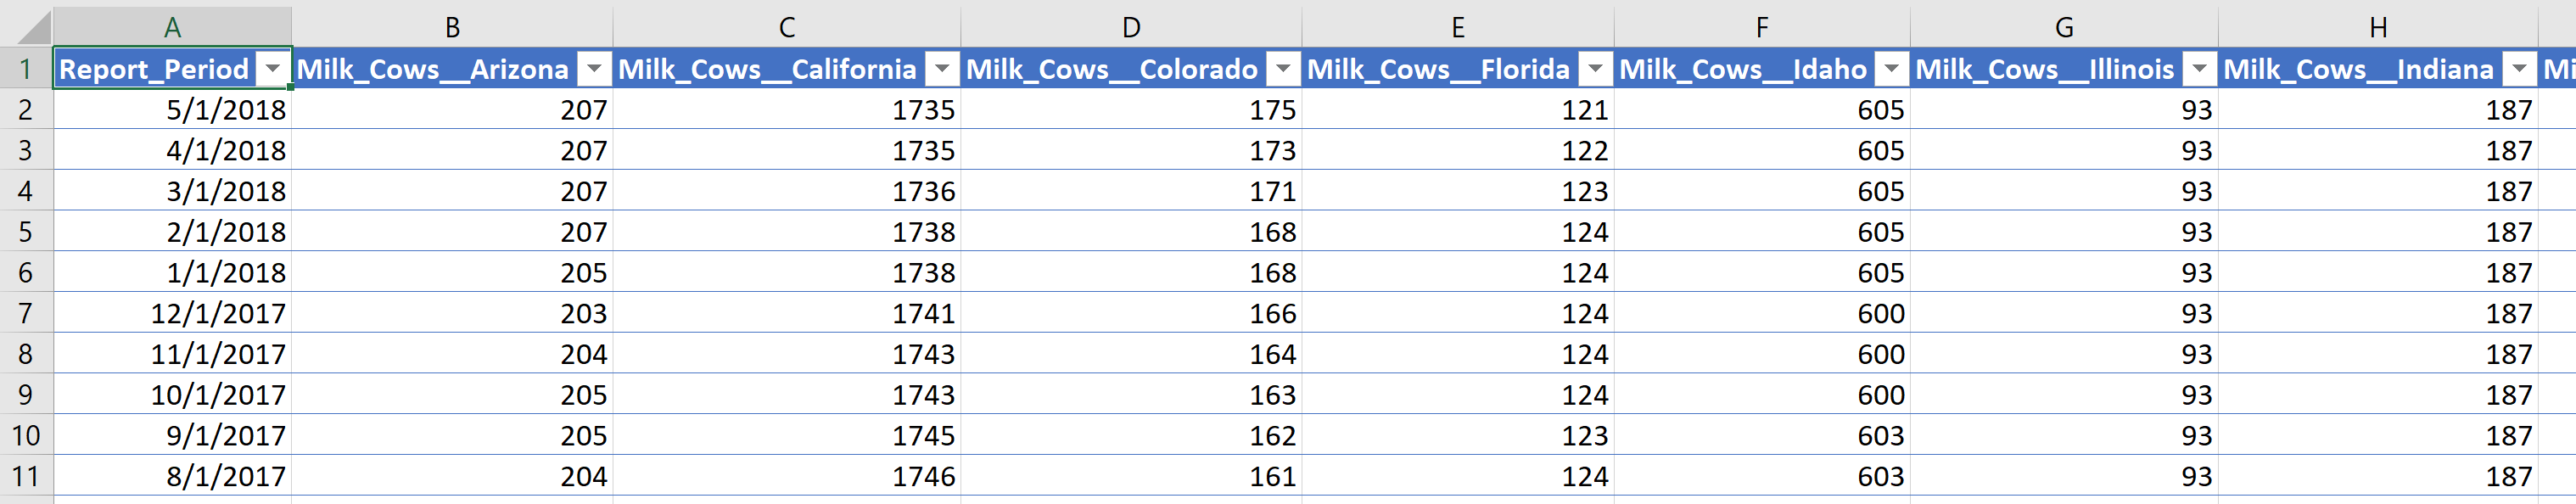
Each column name is a composite string containing the ProductCode (e.g. Milk_Cows) and AreaCode (e.g. New_Mexico), connected with two underscore signs, e.g. Milk_Cows__New_Mexico.
This format is most useful for users who wish to reference the table in their excel files using VLOOKUP formulas or UDMDP() macros.
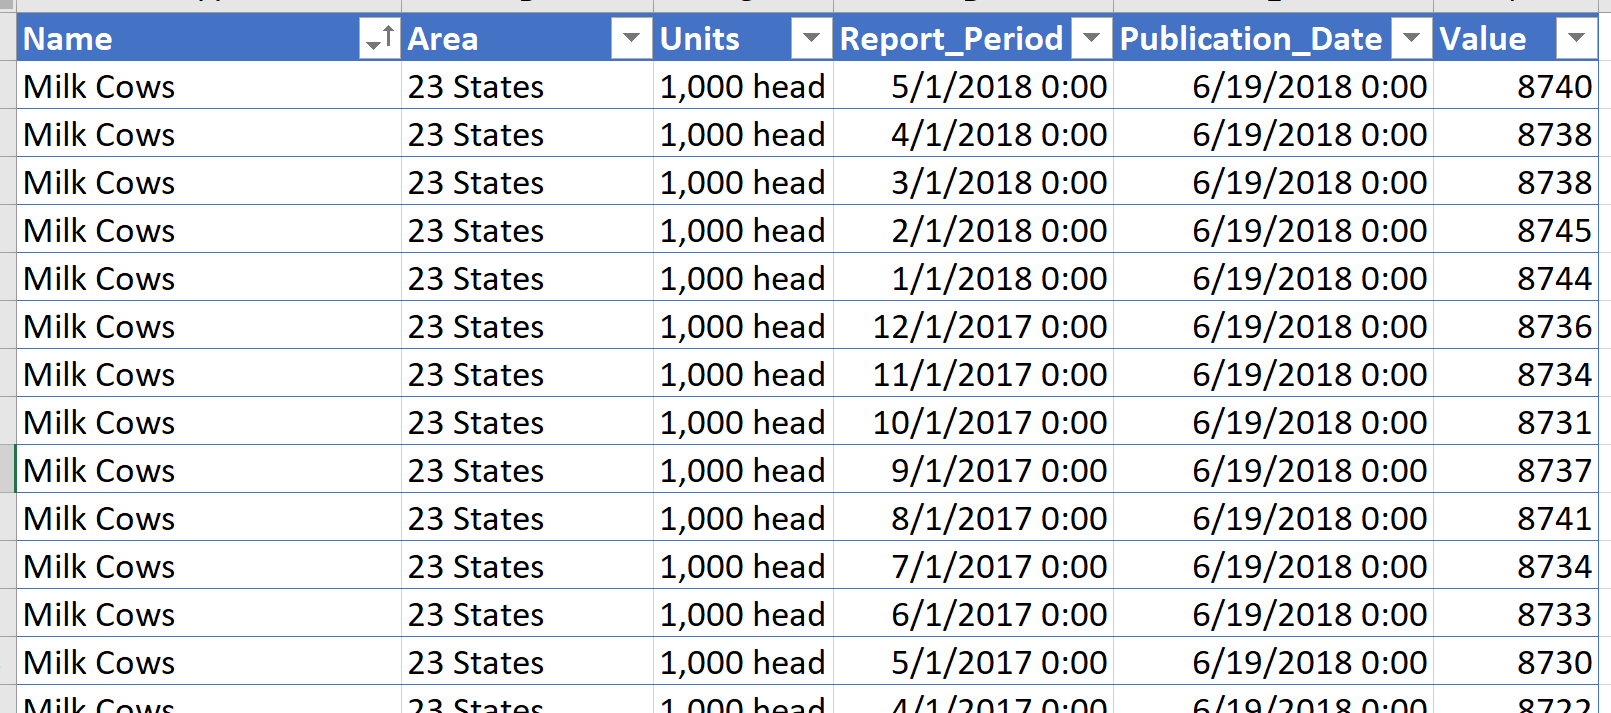
Panel tables, illustrated below with UDM_Report_Milk_Production_Monthly_Panel are designed for pivot tables or similar data transformations within Excel.
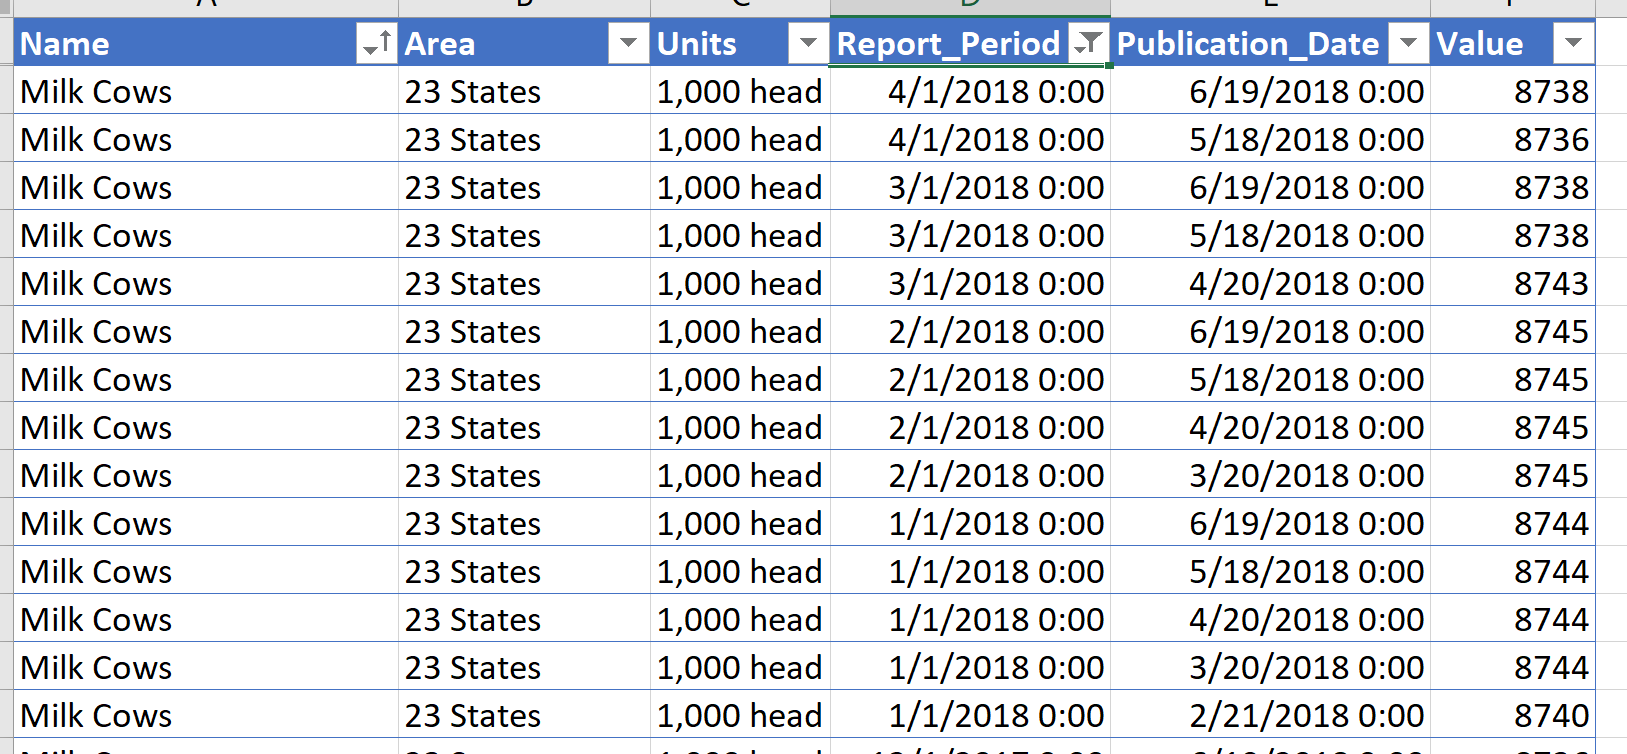
They allow us to disseminate revisions to data points, where such information is economically relevant. Dairy analysts closely track USDA’s revisions to milk cows estimates. To facilitate such analyses all revisions are stored in _Panel tables.
Finally, Panel_Latest tables are in the same format as Panel tables, but do not contain revisions, only the most up-to-date published values. These tables may sometimes be easier to load to data visualization software such as Tableau, when revisions are not of interest.